瀏覽 PPT 提示詞庫
探索 AI PPT 提示詞
已顯示 120 / 120 條
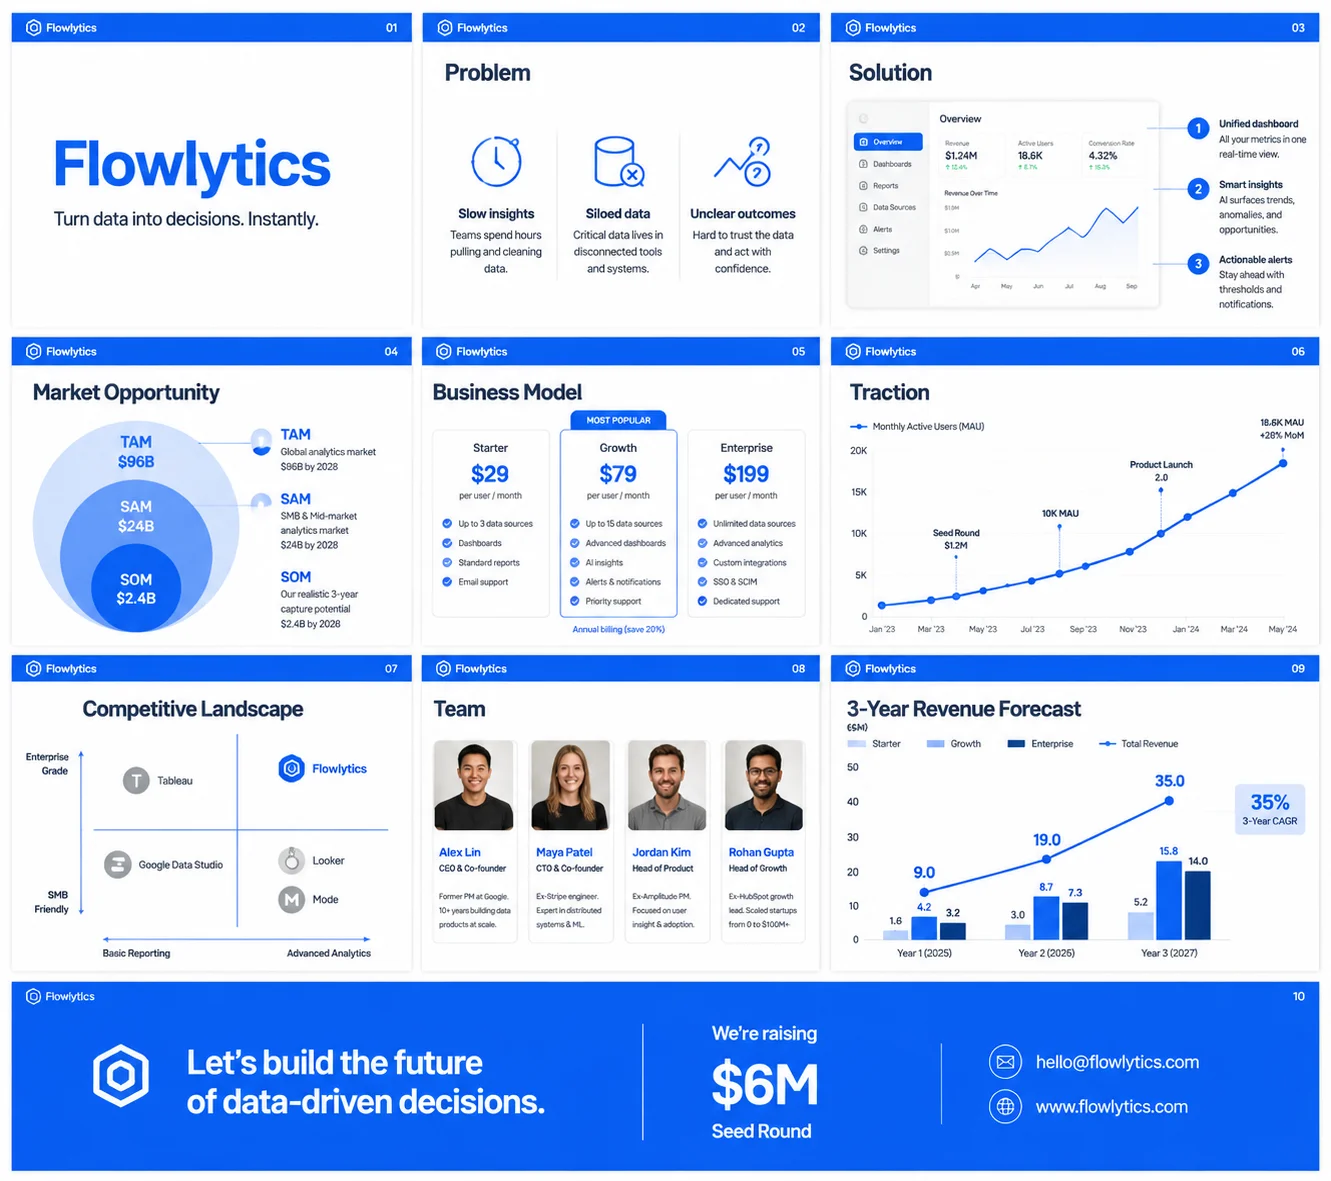
新創公司
Create a 10-slide minimal SaaS startup pitch deck. White background, electric blue #0066FF accent. Slide 1: bold product name + one-line tagline, logo placeholder top-left. Slide 2: Problem — 3 pain points with thin line icons. Slide 3: Solution — UI mockup placeholder, 3 labeled callouts. Slide 4: Market Opportunity — TAM/SAM/SOM nested circles with $ values. Slide 5: Business Model — 3-column pricing table, recommended tier highlighted with a badge. Slide 6: Traction — MoM active users line chart, milestone markers. Slide 7: Competitive Landscape — 2×2 positioning matrix vs 4 named competitors. Slide 8: Team — 4 headshot cards, name/title/one-line bio. Slide 9: 3-Year Revenue Forecast — grouped bar chart, CAGR annotation. Slide 10: Close — full-bleed CTA, funding ask amount, contact email. Font: Inter throughout. Consistent header bar with logo + slide number on every slide. Tone: confident, data-driven, investor-ready.
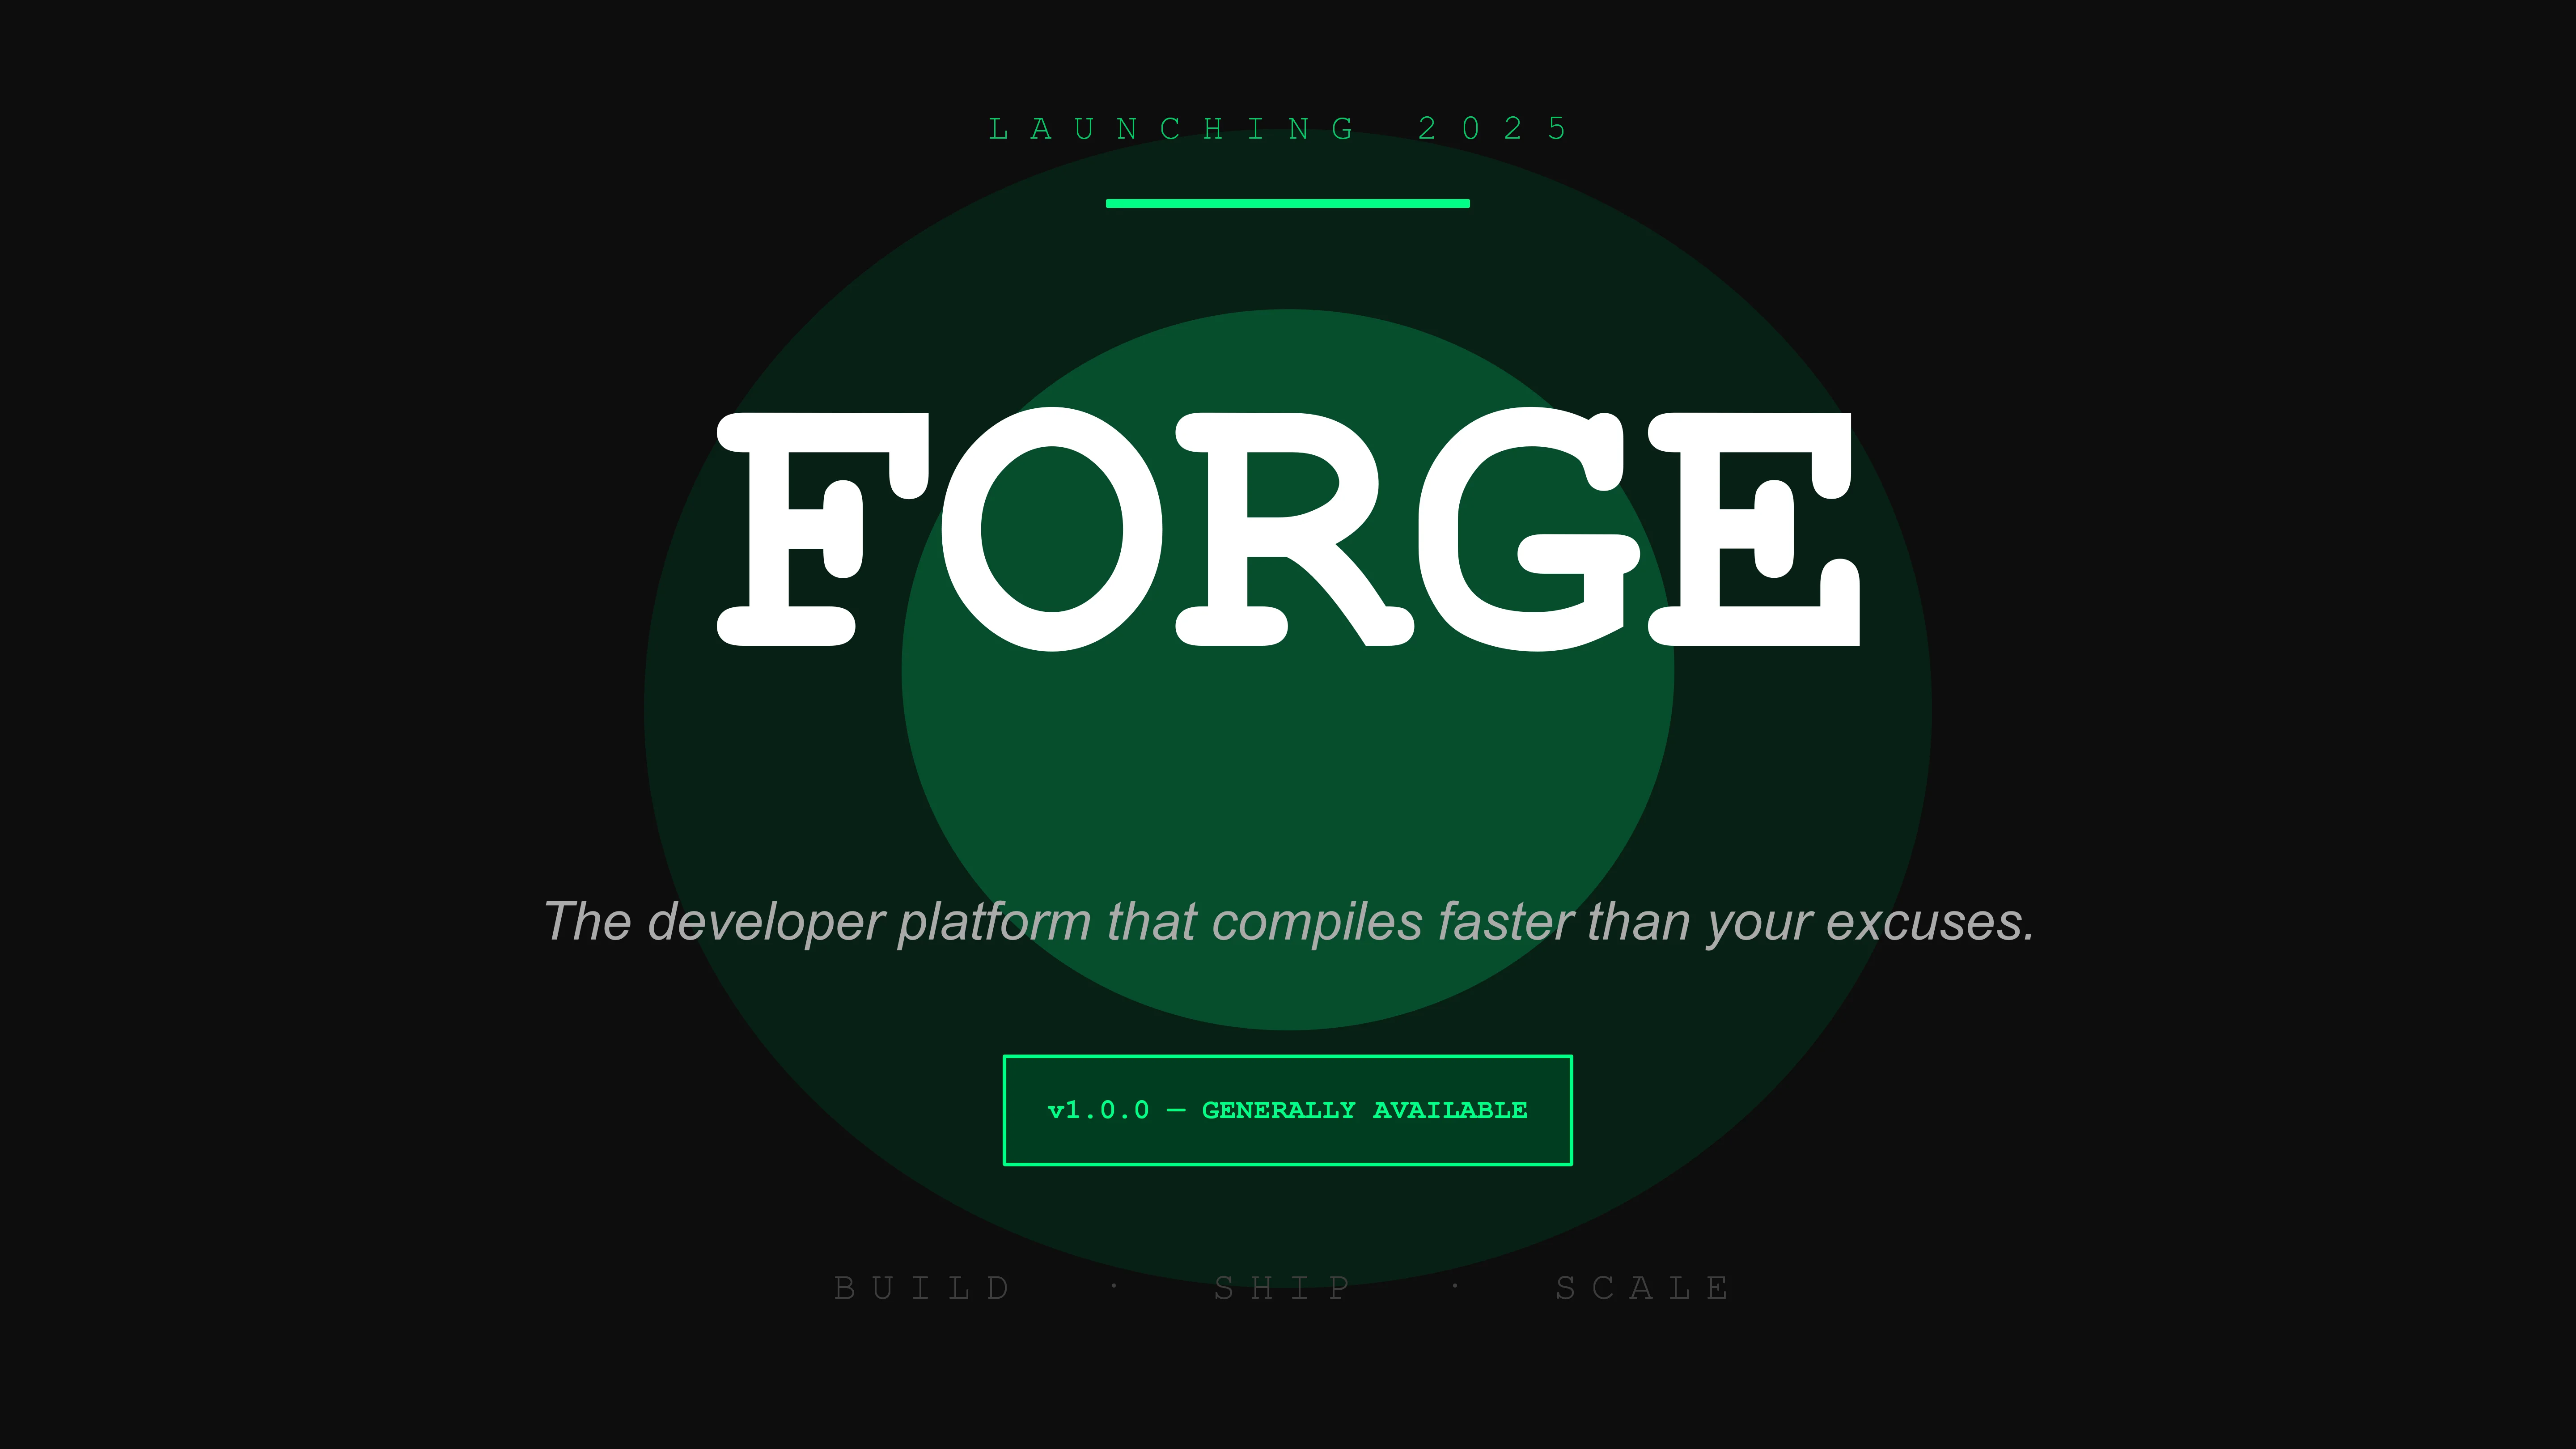
開發者工具
Design a 12-slide dark-mode developer tool launch keynote. Background #0D0D0D, neon green #00FF87 accent. Slide 1: full-bleed hero, product name in JetBrains Mono. Slide 2: Problem — terminal-style error messages as bullet points with red # markers. Slide 3: Product reveal — large screenshot with glowing border and subtle particle effect placeholder. Slides 4-7: four feature slides, alternating code-snippet left / result screenshot right layout. Slide 8: Architecture diagram — dark nodes, luminous connecting arrows, system labels in monospace. Slide 9: Benchmark bar chart — dark bg, green bars vs grey competitor bars. Slide 10: Pricing — 3 dark tier cards, Pro highlighted. Slide 11: GitHub star + Discord join CTA. Slide 12: Launch date countdown closer, full-screen gradient. Font: JetBrains Mono for code elements, Inter for prose. Tone: authoritative, technical, exciting.
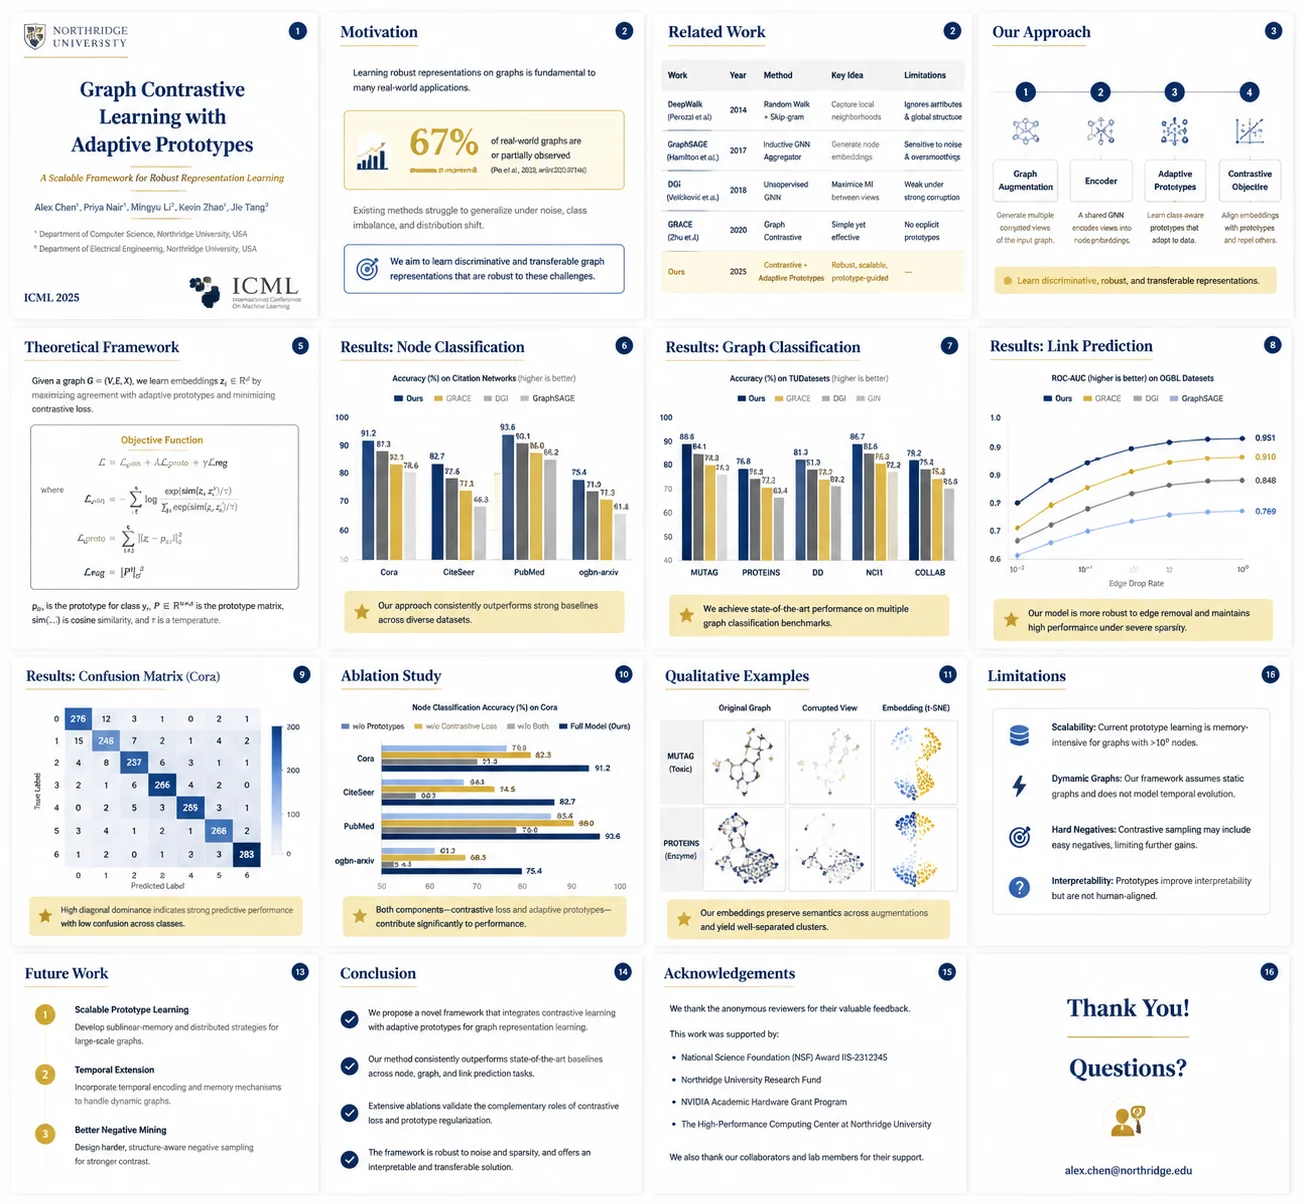
學術研究
Generate a 16-slide academic conference presentation for a machine learning paper. Clean white background, university navy #003087 + gold #C9A84C accents. Include: (1) Title, authors, affiliations, venue logo. (2) Motivation — why this problem matters, with a compelling statistic. (3) Related Work — timeline comparison table. (4) Our Approach — methodology flowchart with 4 numbered stages. (5) Theoretical Framework — key equations in a clean LaTeX-style typeset box. (6-9) Results slides with bar charts, line plots, and confusion matrix, each with a highlighted key finding callout. (10) Ablation Study — horizontal grouped bar chart. (11) Qualitative Examples — 2×3 image grid with captions. (12) Limitations. (13) Future Work — 3 bullet roadmap. (14) Conclusion — 4 takeaway bullets. (15) Acknowledgements. (16) Q&A closer. Font: Source Serif Pro headings, Source Sans Pro body. Tone: rigorous, scholarly.
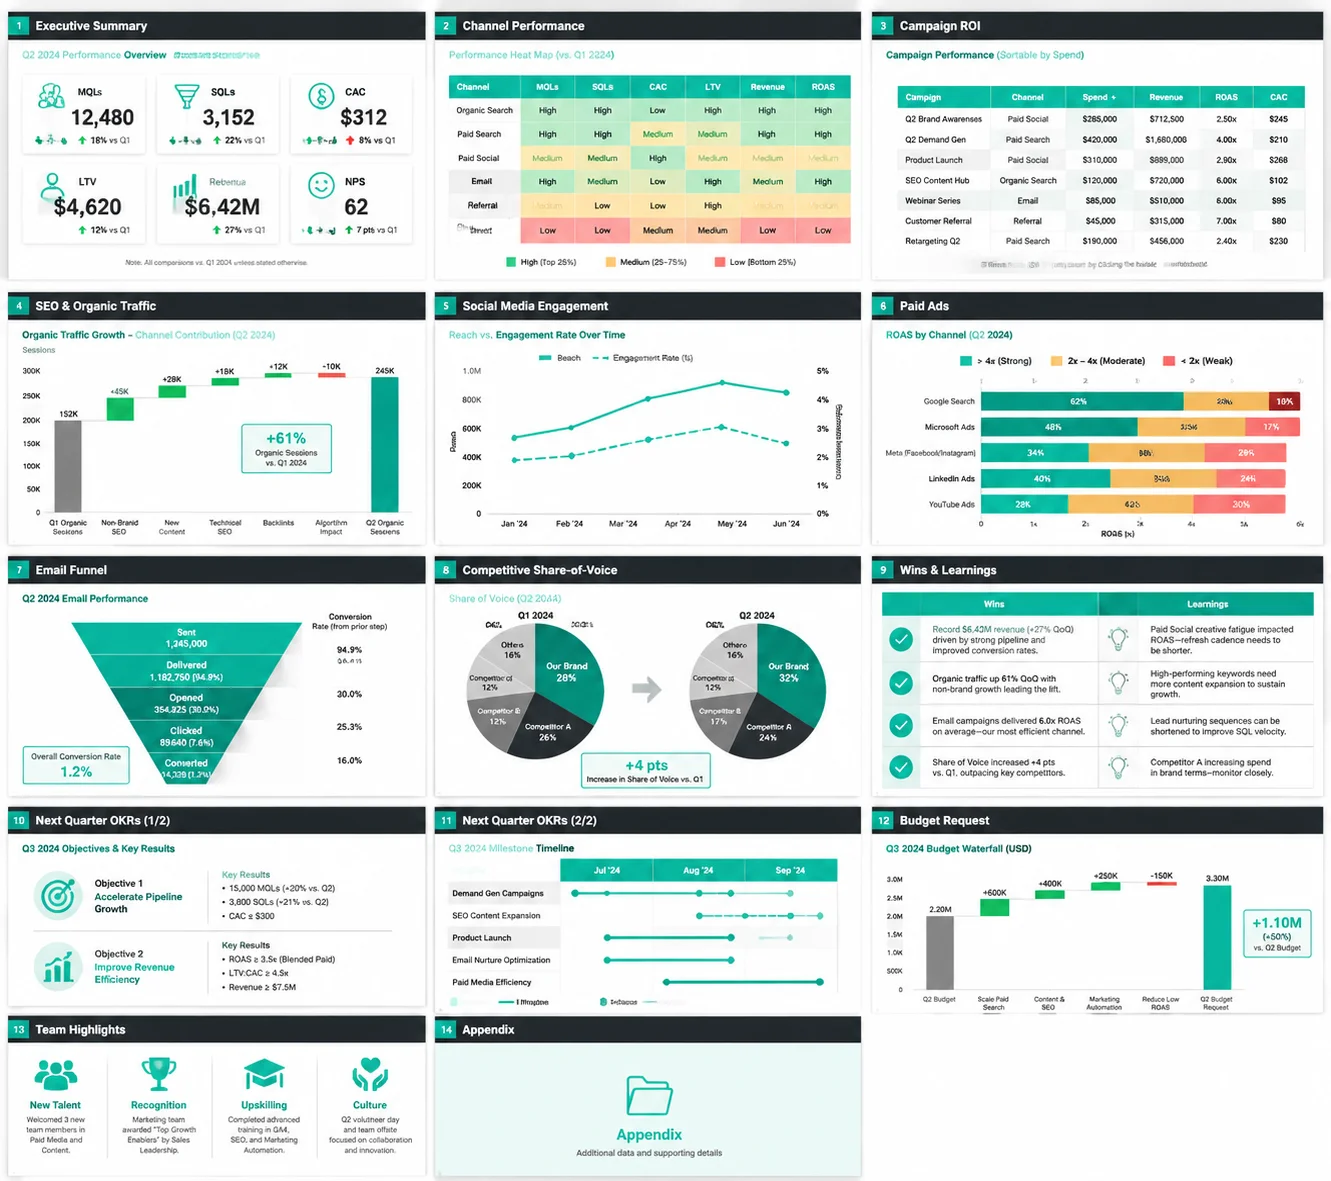
季度業務回顧
Build a 14-slide Marketing Quarterly Business Review (QBR) deck. Corporate style: white background, bold teal #00BFA5 accents, dark grey header bars. Slide 1: Executive Summary — 6-KPI dashboard cards (MQL, SQL, CAC, LTV, Revenue, NPS). Slide 2: Channel Performance — heat map table, red/amber/green coding. Slide 3: Campaign ROI table sortable by spend. Slide 4: SEO & Organic Traffic — waterfall chart showing channel contributions. Slide 5: Social Media Engagement — dual-axis trend chart (reach vs. engagement rate). Slide 6: Paid Ads — ROAS by channel stacked horizontal bar. Slide 7: Email Funnel — conversion funnel diagram. Slide 8: Competitive Share-of-Voice — pie chart comparison. Slide 9: Wins & Learnings — 2-column table. Slides 10-11: Next Quarter OKRs with quarterly milestone timeline. Slide 12: Budget Request — waterfall bar. Slide 13: Team Highlights. Slide 14: Appendix placeholder. Font: Helvetica Neue. Tone: data-driven, executive-ready.
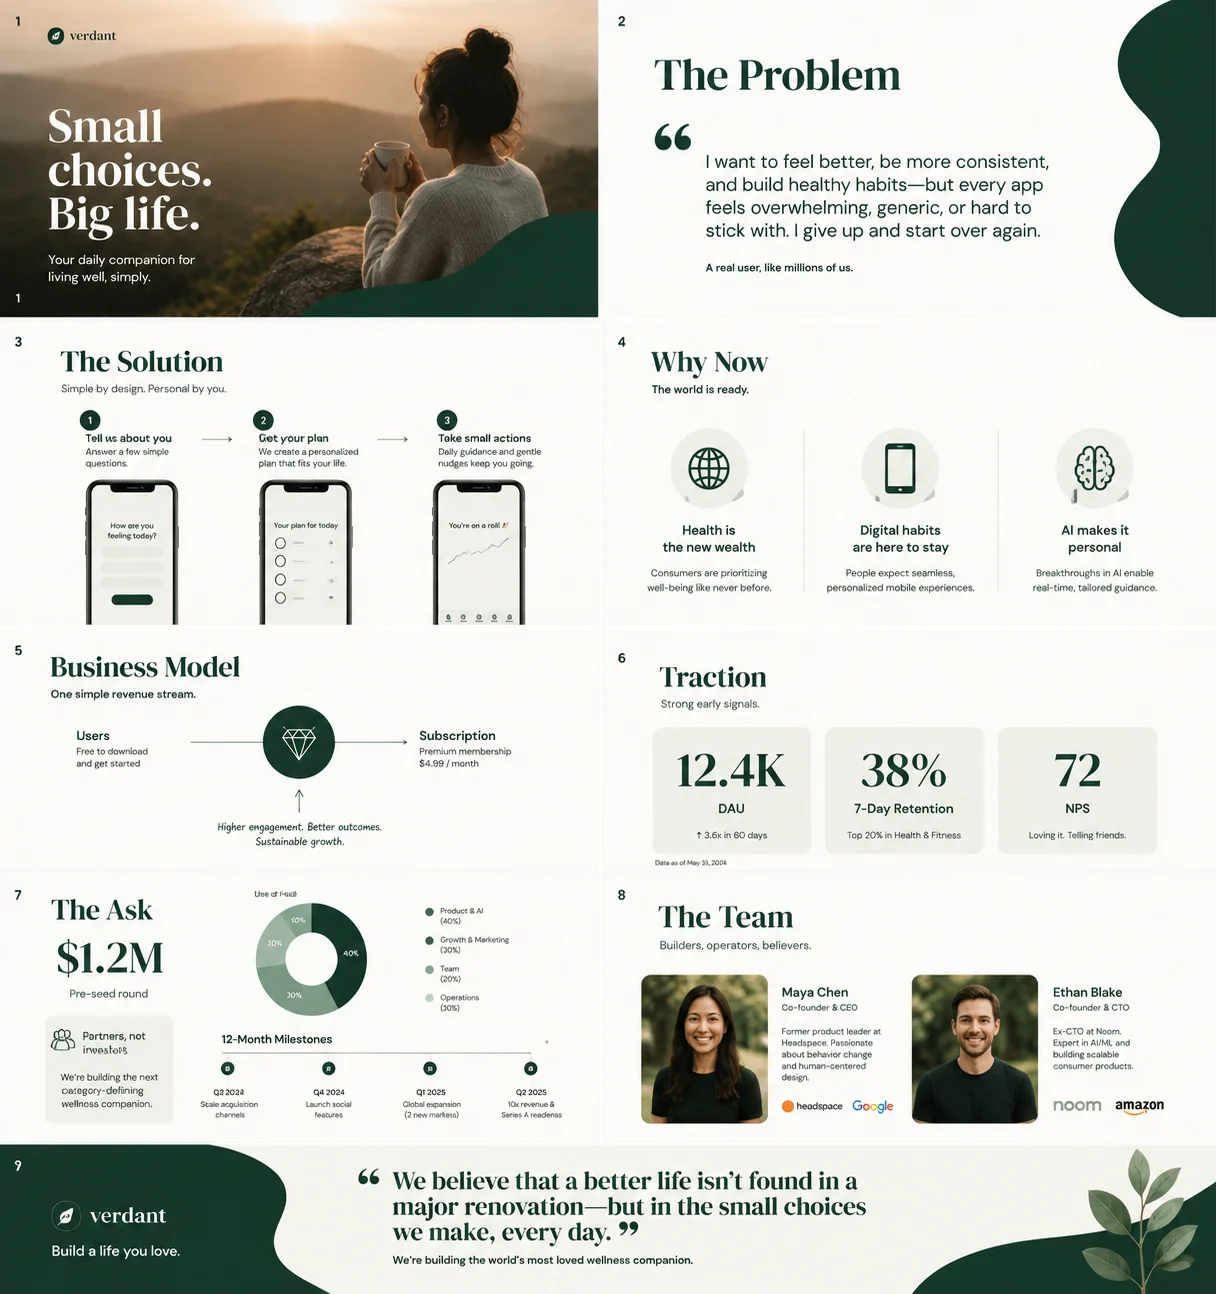
種子前輪
Create a 9-slide pre-seed investor deck for a consumer app. Modern asymmetric layout: off-white #FAF9F6 background, deep forest green #1A3C2D accent. Slide 1: Full-bleed lifestyle hero image placeholder + tagline overlay. Slide 2: The Problem — relatable 30-word user story quote with large typography. Slide 3: Solution — 3-step user journey with phone mockup placeholders. Slide 4: Why Now — market timing slide with 3 macro trend icons + one-liner each. Slide 5: Business Model — single illustrated revenue stream diagram. Slide 6: Traction — key metrics in large-number cards (DAU, retention, NPS). Slide 7: The Ask — funding amount, use of funds donut chart, 12-month milestone timeline. Slide 8: Team — founder photos, 2-sentence bios, notable logos. Slide 9: Vision — inspirational closer with brand manifesto quote. Font: DM Serif Display headings, DM Sans body. Tone: warm, human, compelling.
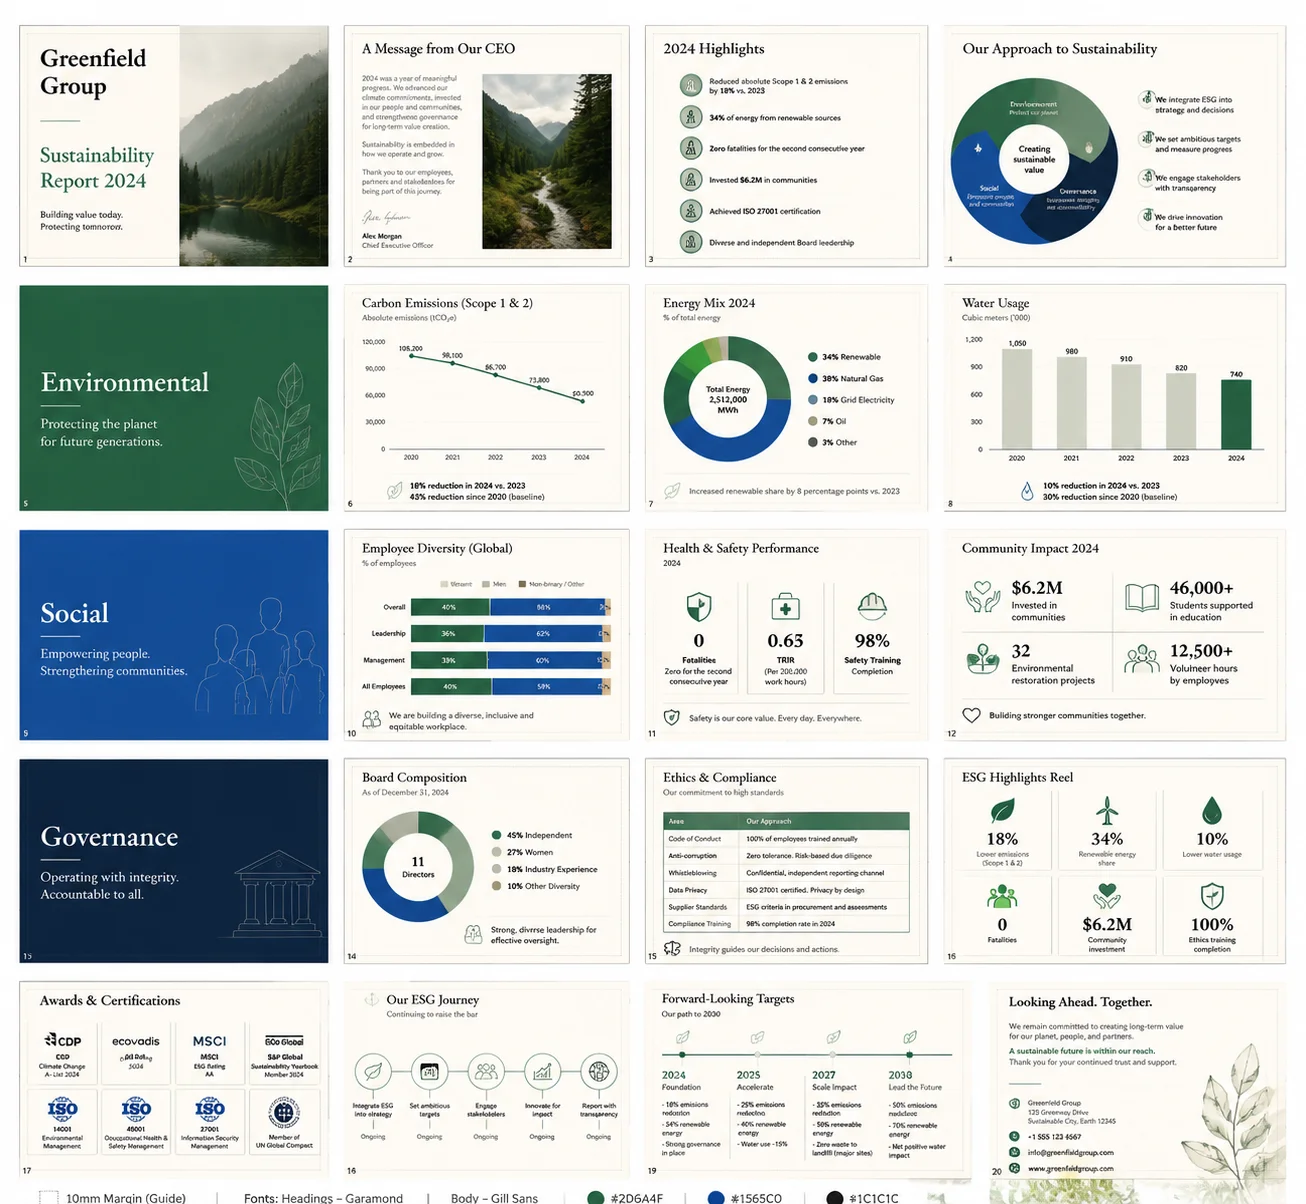
ESG 報告
Design a 20-slide ESG Annual Report executive summary presentation. Editorial style: warm ivory #FDFBF5 background, dark charcoal #1C1C1C text, forest green #2D6A4F and ocean blue #1565C0 for section dividers. Cover: company name, 'Sustainability Report 2024', hero landscape photo placeholder. Section dividers (3 total) for Environmental, Social, Governance. Environmental: carbon emissions line chart, energy mix donut, water usage bar. Social: employee diversity stacked bar, safety metrics KPIs, community impact infographic. Governance: board composition chart, ethics policy summary table. Highlights reel: 6 achievement cards with icons and numbers. Awards & certifications logos grid. Forward-looking targets timeline (2024–2030). Back cover: contact details. Fonts: Garamond headings, Gill Sans body. Print-quality with 10mm margin guidelines. Tone: transparent, accountable, optimistic.
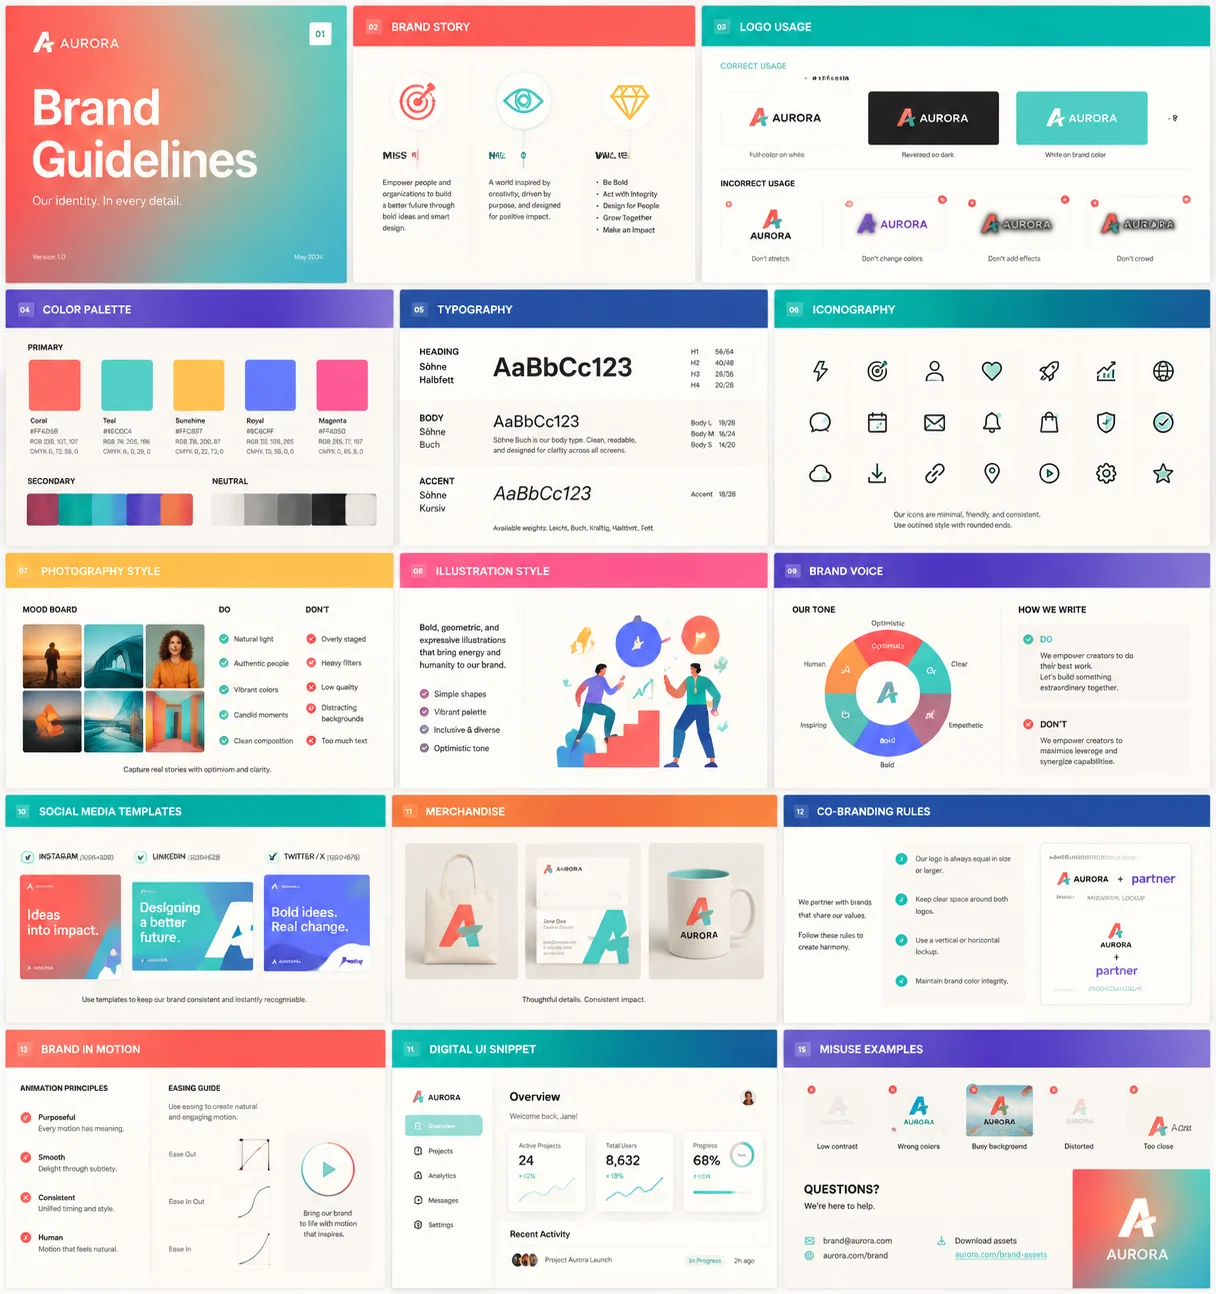
品牌
Create a 15-slide brand identity guidelines deck. Vibrant style with a gradient cover (#FF6B6B → #4ECDC4). Each section has a strong color-block header. Sections: Brand Story (mission, vision, values cards); Logo Usage (correct vs incorrect usage examples grid); Color Palette (primary + secondary + neutral swatches with hex, RGB, CMYK codes); Typography (heading/body/accent type specimens with size scale); Iconography (icon set sample grid); Photography Style (mood board placeholder, do/don't examples); Illustration Style (placeholder); Brand Voice (tone adjectives wheel, writing examples); Social Media Templates (Instagram, LinkedIn, Twitter mockup placeholders); Merchandise mockups (tote bag, business card, mug placeholder); Co-branding rules; Brand in Motion (animation principles, easing guide); Digital UI snippet; Misuse examples gallery; Contact + Download links. Font: the brand's own typeface or Söhne. Tone: confident, inspiring, systematic.
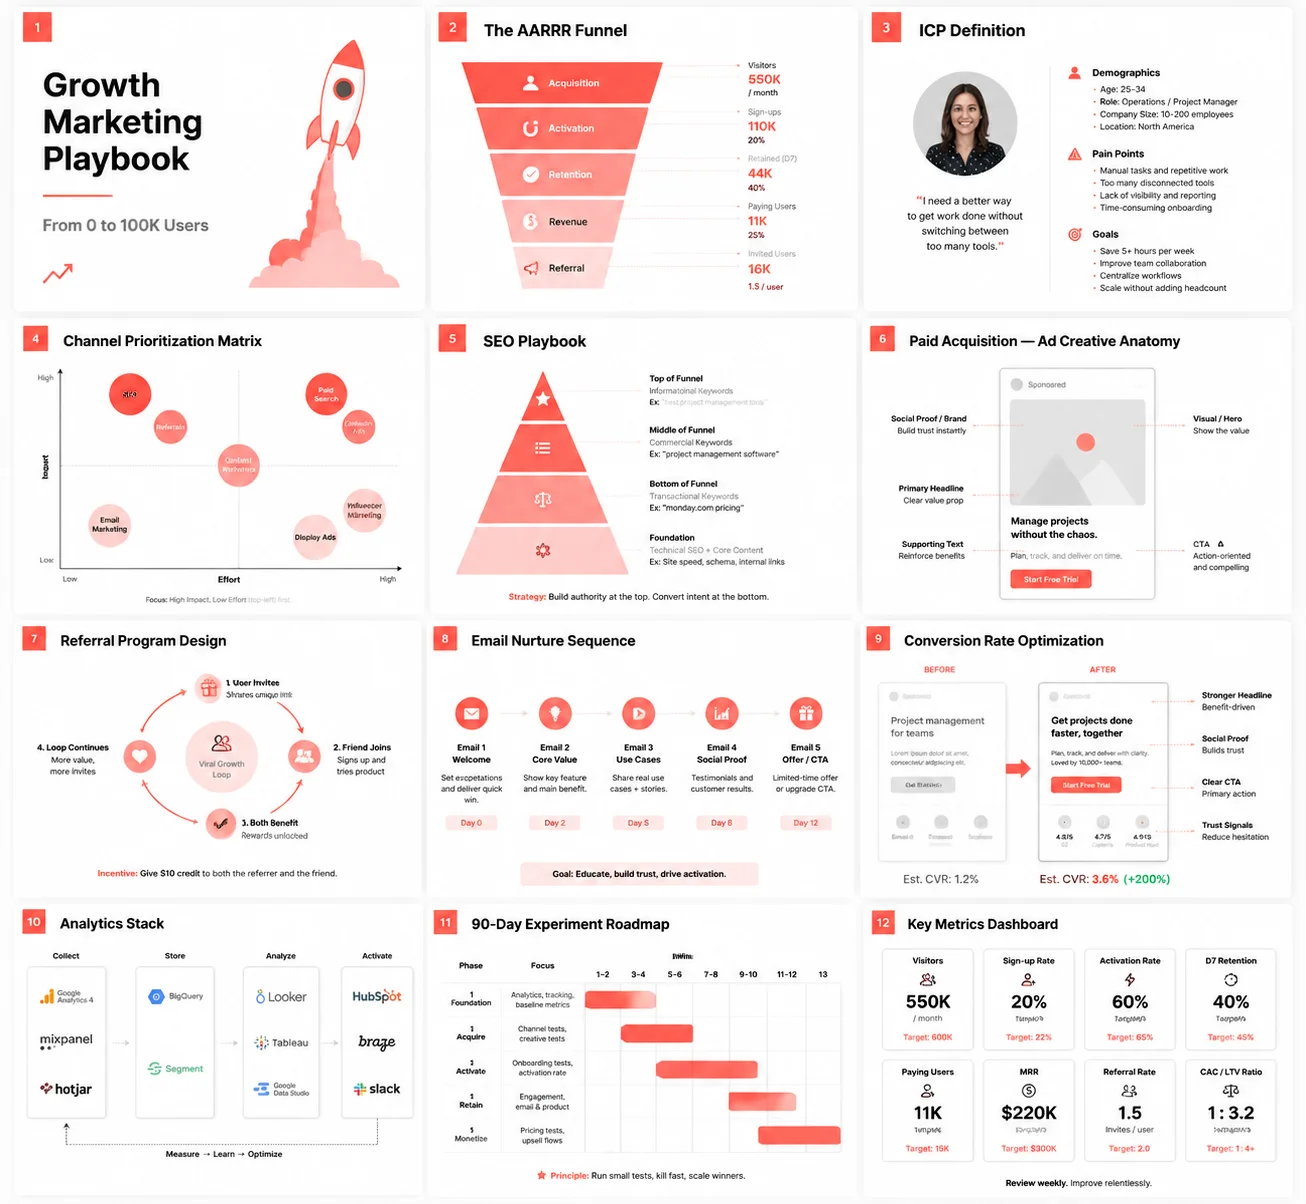
成長
Build a 12-slide growth marketing playbook presentation. Minimal style: white background, coral #FF4F4F accent, generous whitespace. Slide 1: title + subtitle 'From 0 to 100K Users'. Slide 2: The AARRR Funnel — illustrated funnel diagram with metric at each stage. Slide 3: ICP Definition — persona card with photo placeholder, demographics, pain points, goals. Slide 4: Channel Prioritization Matrix — effort vs. impact scatter plot with labeled channel bubbles. Slide 5: SEO Playbook — keyword strategy pyramid. Slide 6: Paid Acquisition — ad creative anatomy diagram. Slide 7: Referral Program Design — loop diagram. Slide 8: Email Nurture Sequence — horizontal timeline flow. Slide 9: Conversion Rate Optimization — before/after landing page annotated comparison. Slide 10: Analytics Stack — tool logos grid with data flow arrows. Slide 11: 90-Day Experiment Roadmap — Gantt-style timeline. Slide 12: Key Metrics Dashboard — 8 KPI cards with targets. Font: Inter. Tone: strategic, actionable, data-backed.
產品藍圖
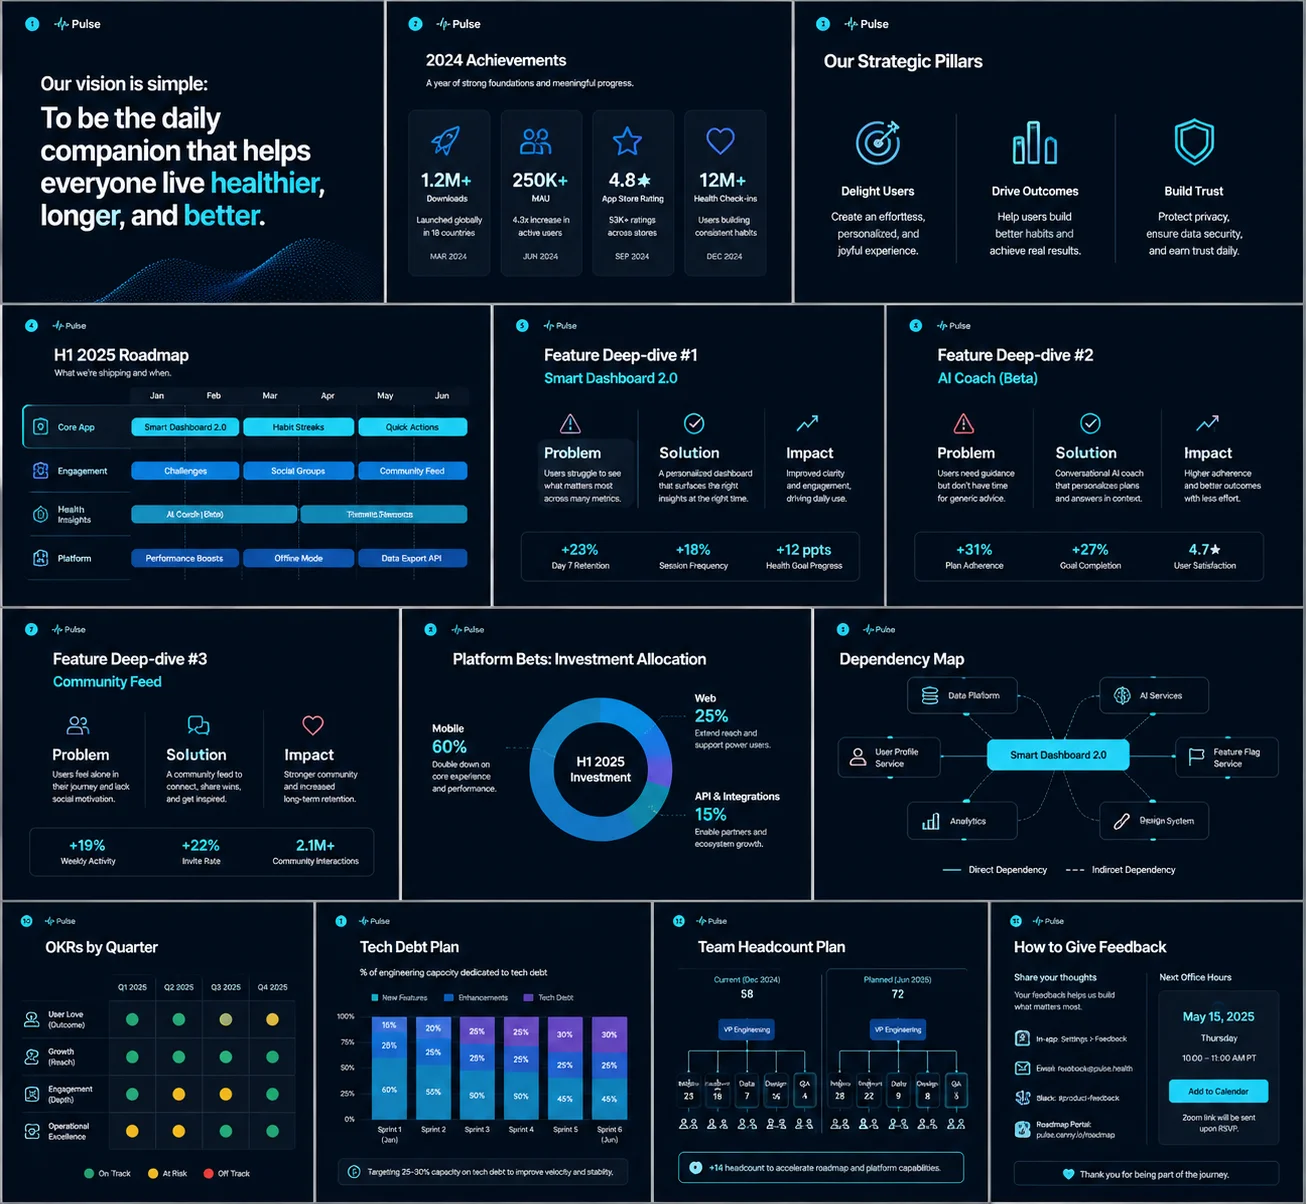
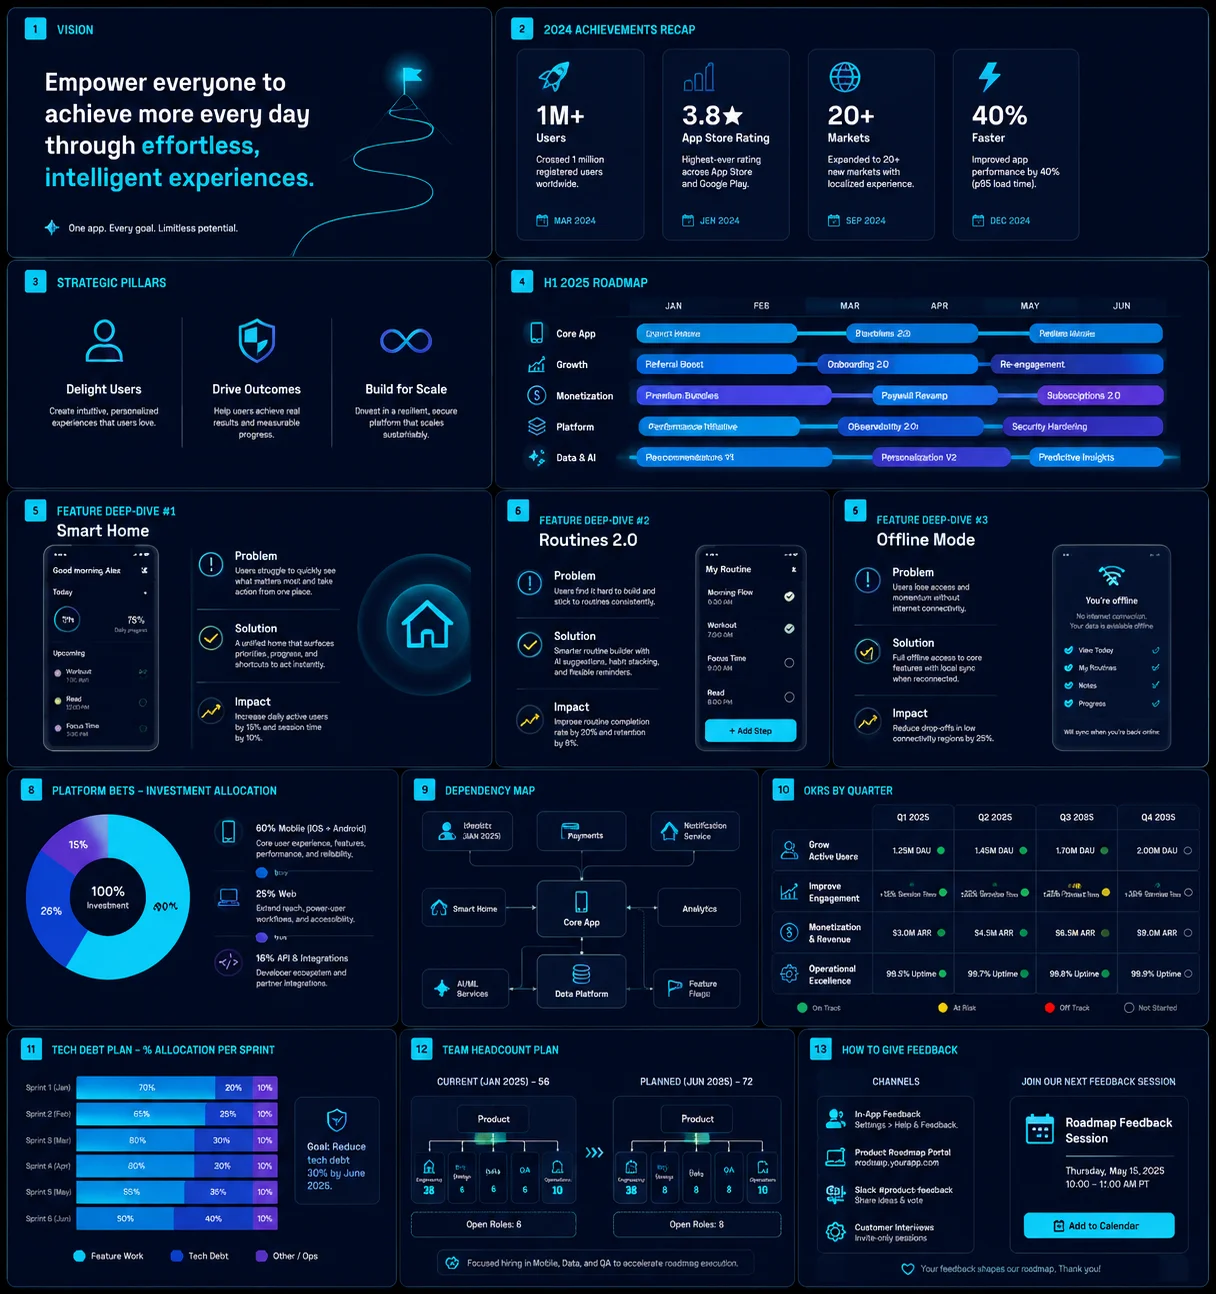
Generate a 13-slide product roadmap presentation for a mobile app. Modern style: deep navy #0B1E3D background with white text, cyan #00D4FF accent highlights. Slide 1: Vision statement — bold one-sentence manifesto. Slide 2: 2024 Achievements recap — 4 milestone cards with icons and dates. Slide 3: Strategic Pillars — 3 column icons with one-liner each. Slide 4: H1 2025 Roadmap — horizontal swim-lane timeline by product area. Slide 5: Feature Deep-dive #1 — problem/solution/impact layout. Slides 6-7: Two more feature deep-dives. Slide 8: Platform bets — mobile vs web vs API investment allocation donut. Slide 9: Dependency Map — linked node diagram. Slide 10: OKRs by Quarter — 2×4 grid with RAG status. Slide 11: Tech Debt Plan — stacked bar showing % allocation per sprint. Slide 12: Team Headcount Plan — current vs. planned org chart. Slide 13: How to Give Feedback — channels + calendar invite placeholder. Font: Space Grotesk. Tone: transparent, strategic, execution-focused.
大學課件
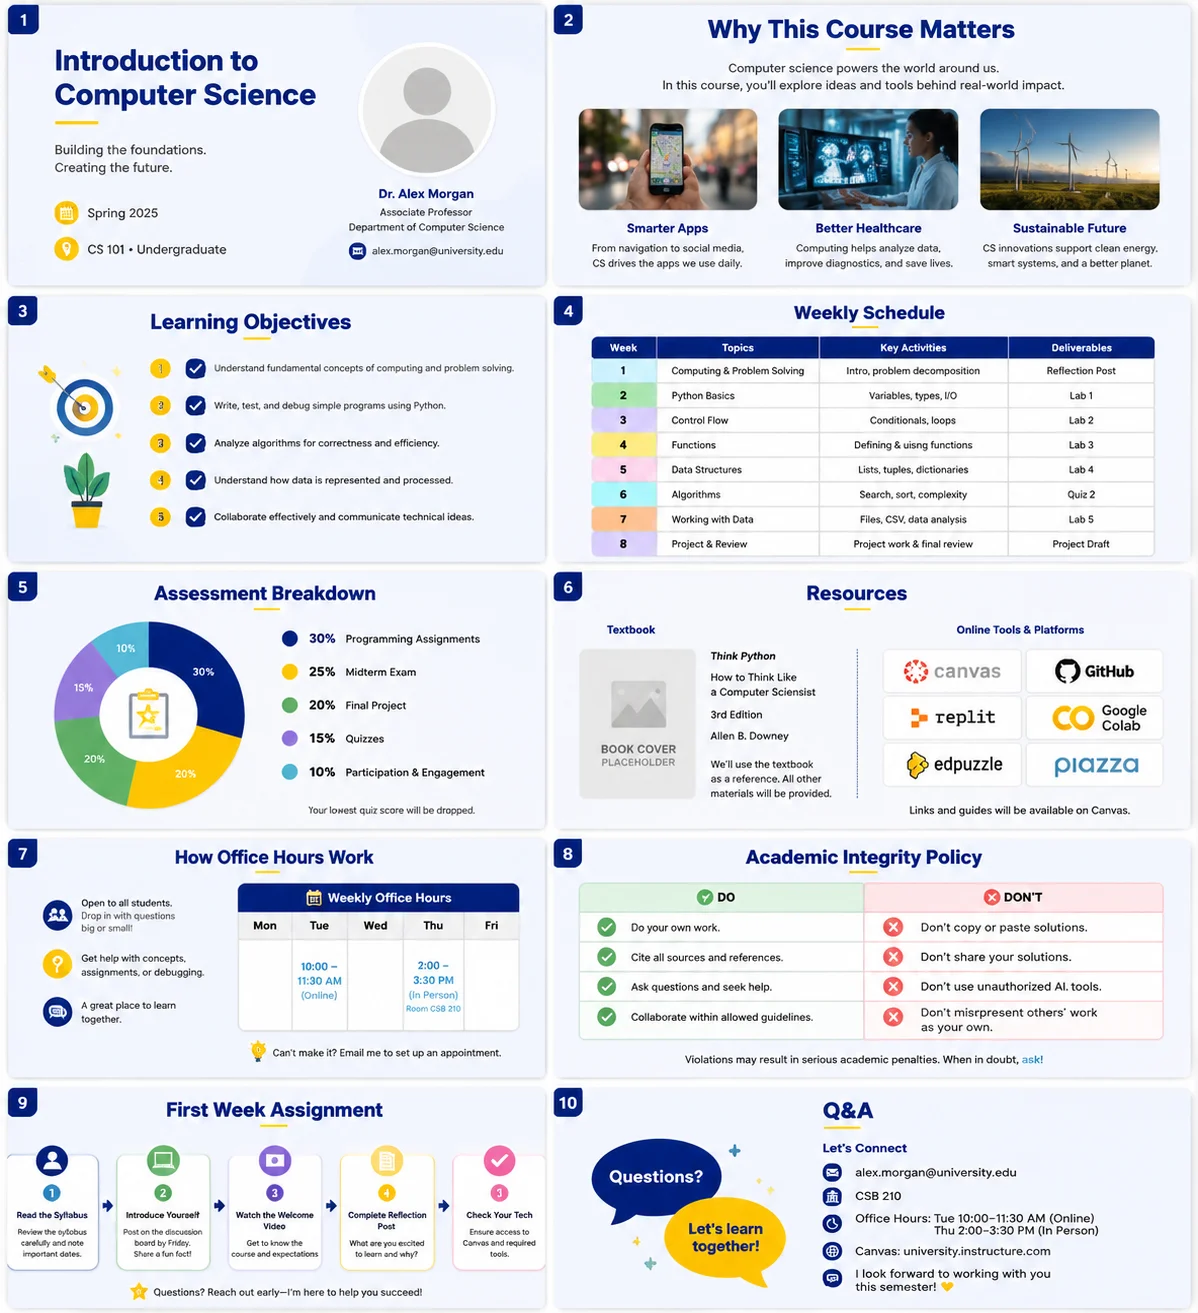
Create a 10-slide introductory course slides for a university computer science module. Friendly academic style: soft blue #EEF4FF background, warm navy #1A237E headings, yellow #FFC107 highlights. Slide 1: Course title, instructor name, photo placeholder, semester info. Slide 2: Why This Course Matters — real-world applications with 3 photo placeholders. Slide 3: Learning Objectives — numbered list with checkmark icons. Slide 4: Weekly Schedule — colorful table overview of topics. Slide 5: Assessment Breakdown — donut chart of grade weightings. Slide 6: Resources — textbook cover placeholder, online tools logos. Slide 7: How Office Hours Work — visual schedule calendar. Slide 8: Academic Integrity Policy — dos/don'ts two-column table. Slide 9: First Week Assignment — step-by-step card layout. Slide 10: Q&A + contact details. Font: Nunito for headings, Open Sans for body. Tone: welcoming, clear, encouraging.
B2B 銷售
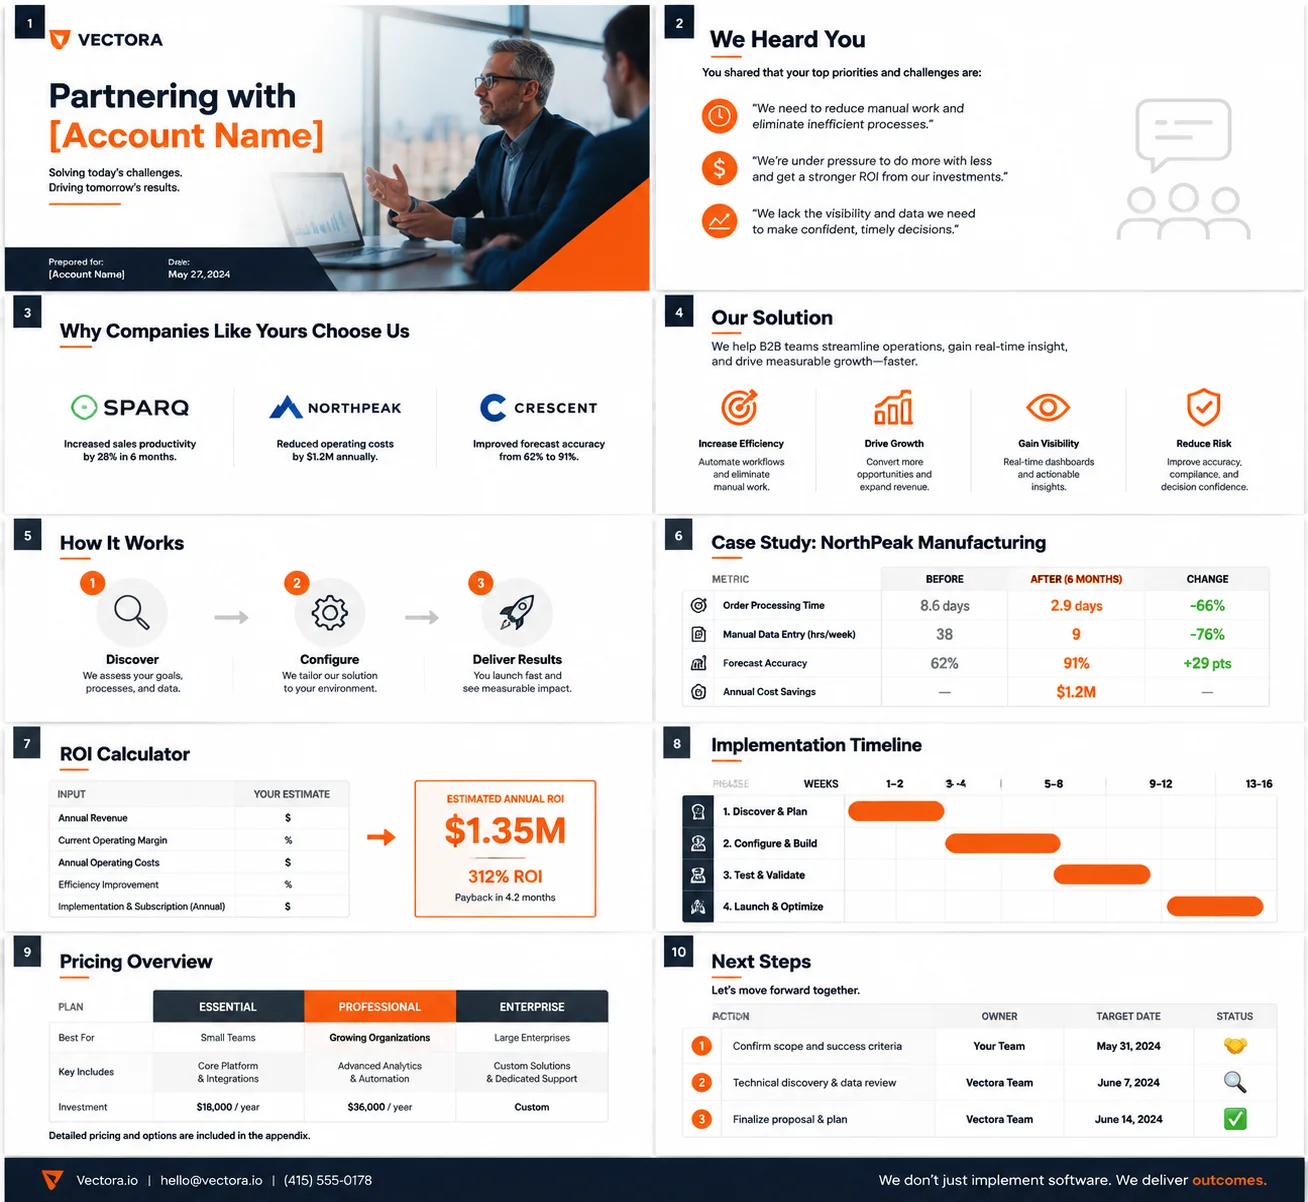
Design a 10-slide B2B sales discovery and pitch deck. Corporate professional style: white + dark slate #1E293B + vibrant orange #F97316. Slide 1: Account name personalization slot + your company logo. Slide 2: We Heard You — mirror back the prospect's 3 stated pain points in their own language. Slide 3: Why Companies Like Yours Choose Us — 3 logos + one-sentence outcome each. Slide 4: Our Solution — value proposition in one sentence, 4 benefit icons below. Slide 5: How It Works — 3-step illustrated process. Slide 6: Case Study — metrics before/after comparison cards. Slide 7: ROI Calculator — simple input table with output highlight box. Slide 8: Implementation Timeline — 4-phase Gantt. Slide 9: Pricing Overview — simplified tier table (detailed in appendix). Slide 10: Next Steps — 3 clear action items with owner/date/emoji. Font: Inter. Tone: consultative, prospect-centric, action-oriented.
B 輪募資
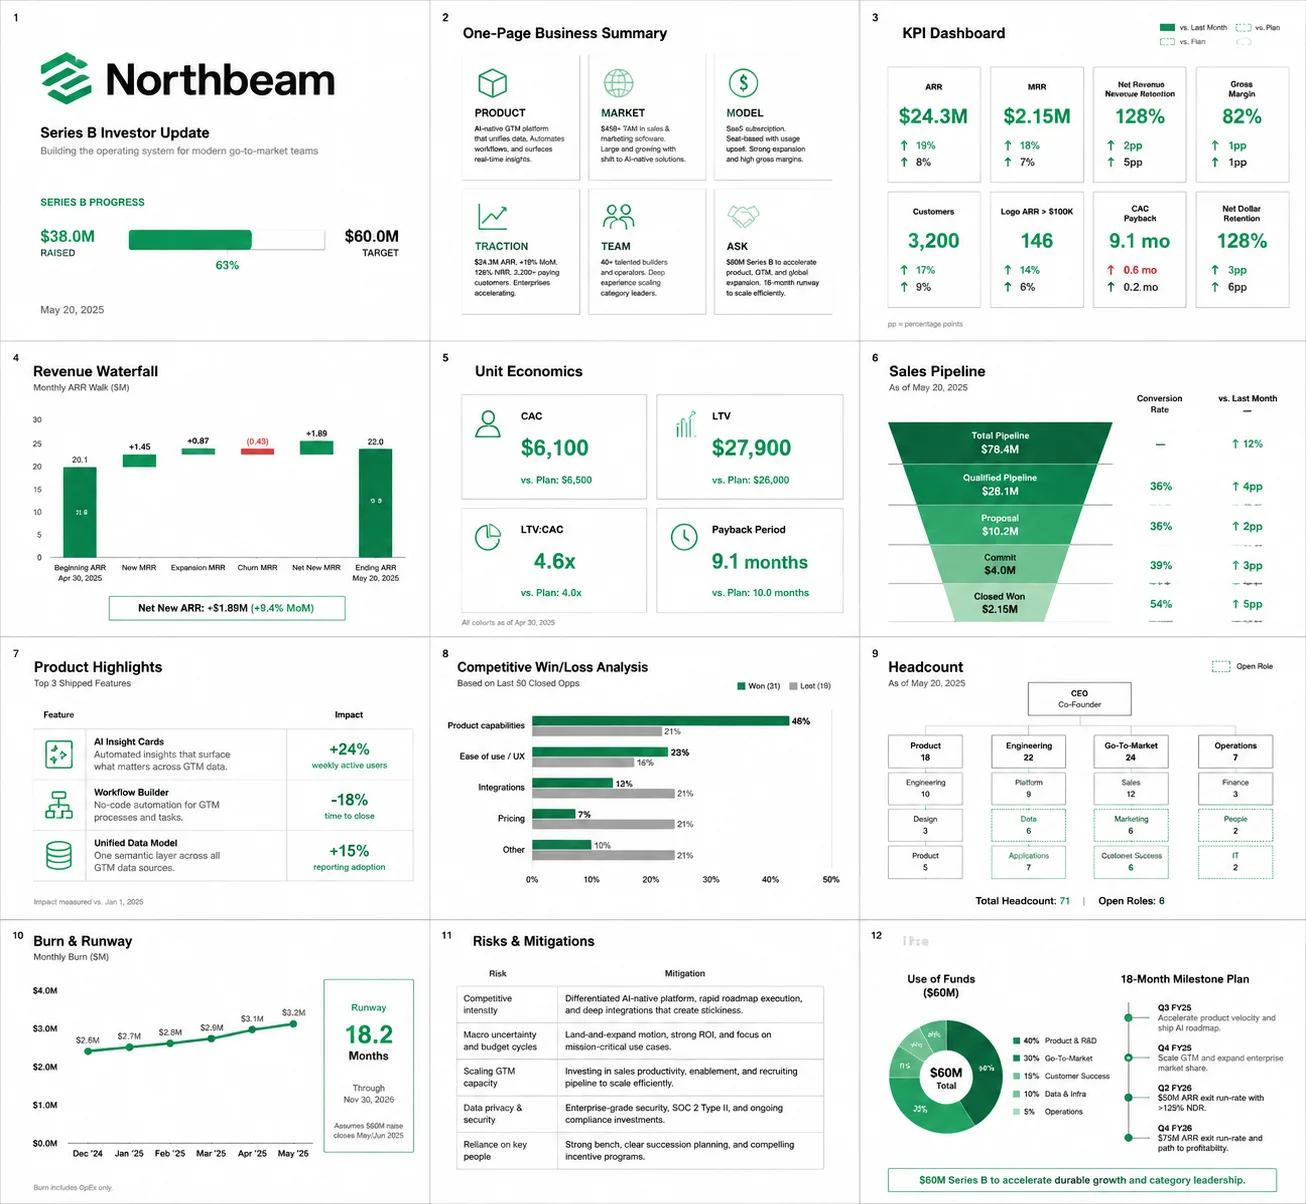
Build a 12-slide Series B investor update board deck. Ultra-minimal executive style: white background, thin black divider lines, single accent color — emerald #059669. Slide 1: Company name, Series B progress bar (raised vs. target), date. Slide 2: One-Page Business Summary — 6-cell grid covering product, market, model, traction, team, ask. Slide 3: KPI Dashboard — 8 large-number cards vs. last month and vs. plan. Slide 4: Revenue Waterfall — new / expansion / churn / net new MRR. Slide 5: Unit Economics — CAC, LTV, LTV:CAC, payback period in 2×2 metric cards. Slide 6: Sales Pipeline — funnel with conversion rates at each stage. Slide 7: Product Highlights — top 3 shipped features with impact metric. Slide 8: Competitive Win/Loss Analysis — bar chart by reason. Slide 9: Headcount — current org chart, open roles highlighted. Slide 10: Burn & Runway — monthly burn line chart, runway callout box. Slide 11: Risks & Mitigations — 2-column table. Slide 12: The Ask — use of funds allocation and 18-month milestone plan. Font: Inter. Tone: transparent, rigorous, investor-grade.
系統架構
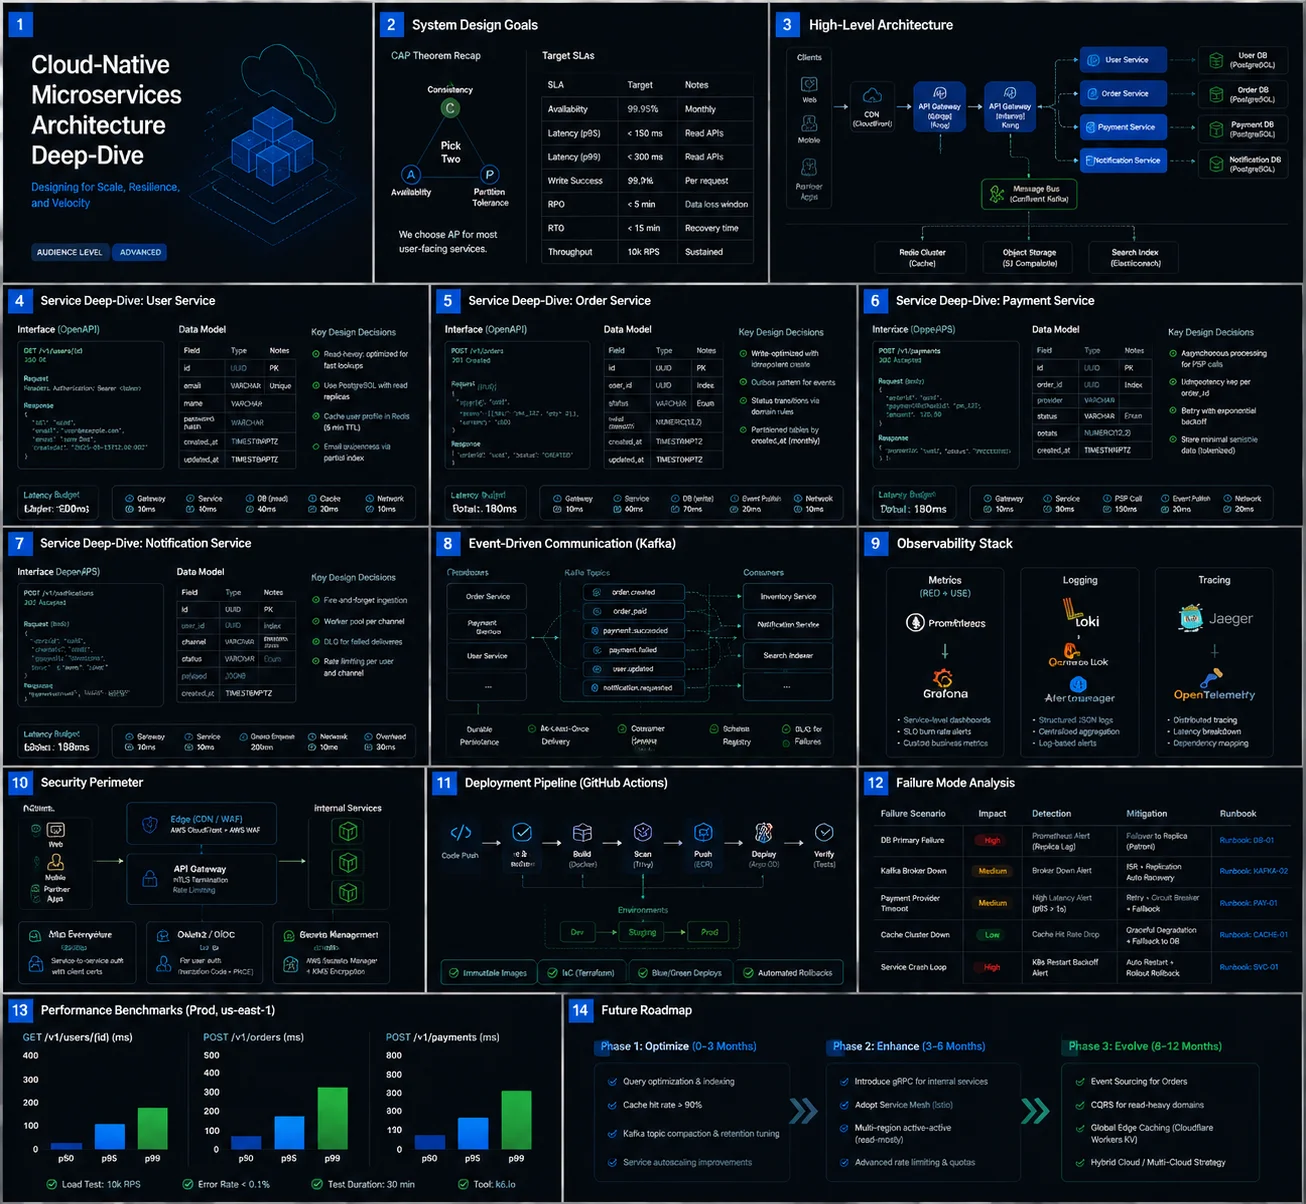
Create a 14-slide cloud-native microservices architecture deep-dive for a technical audience. Dark theme: #0A0E17 background, electric blue #3B82F6 and green #22C55E highlights, white text. Slide 1: Title + audience level indicator (Advanced). Slide 2: System Design Goals — CAP theorem recap, target SLAs table. Slide 3: High-Level Architecture Diagram — service boxes with labeled API gateways, message queues, databases, CDN. Slides 4-7: Four service deep-dives — each shows service interface contract, data model, key design decisions, latency budget. Slide 8: Event-Driven Communication — Kafka topic flow diagram. Slide 9: Observability Stack — metrics/logging/tracing three-pillar diagram with tool logos. Slide 10: Security Perimeter — mTLS, OAuth2, secrets management illustrated. Slide 11: Deployment Pipeline — CI/CD flow diagram with GitHub Actions stages. Slide 12: Failure Mode Analysis — runbook table. Slide 13: Performance Benchmarks — p50/p95/p99 latency bar charts. Slide 14: Future Roadmap — 3 architectural evolution phases. Font: JetBrains Mono + Inter. Tone: detailed, precise, engineering-grade.
TED
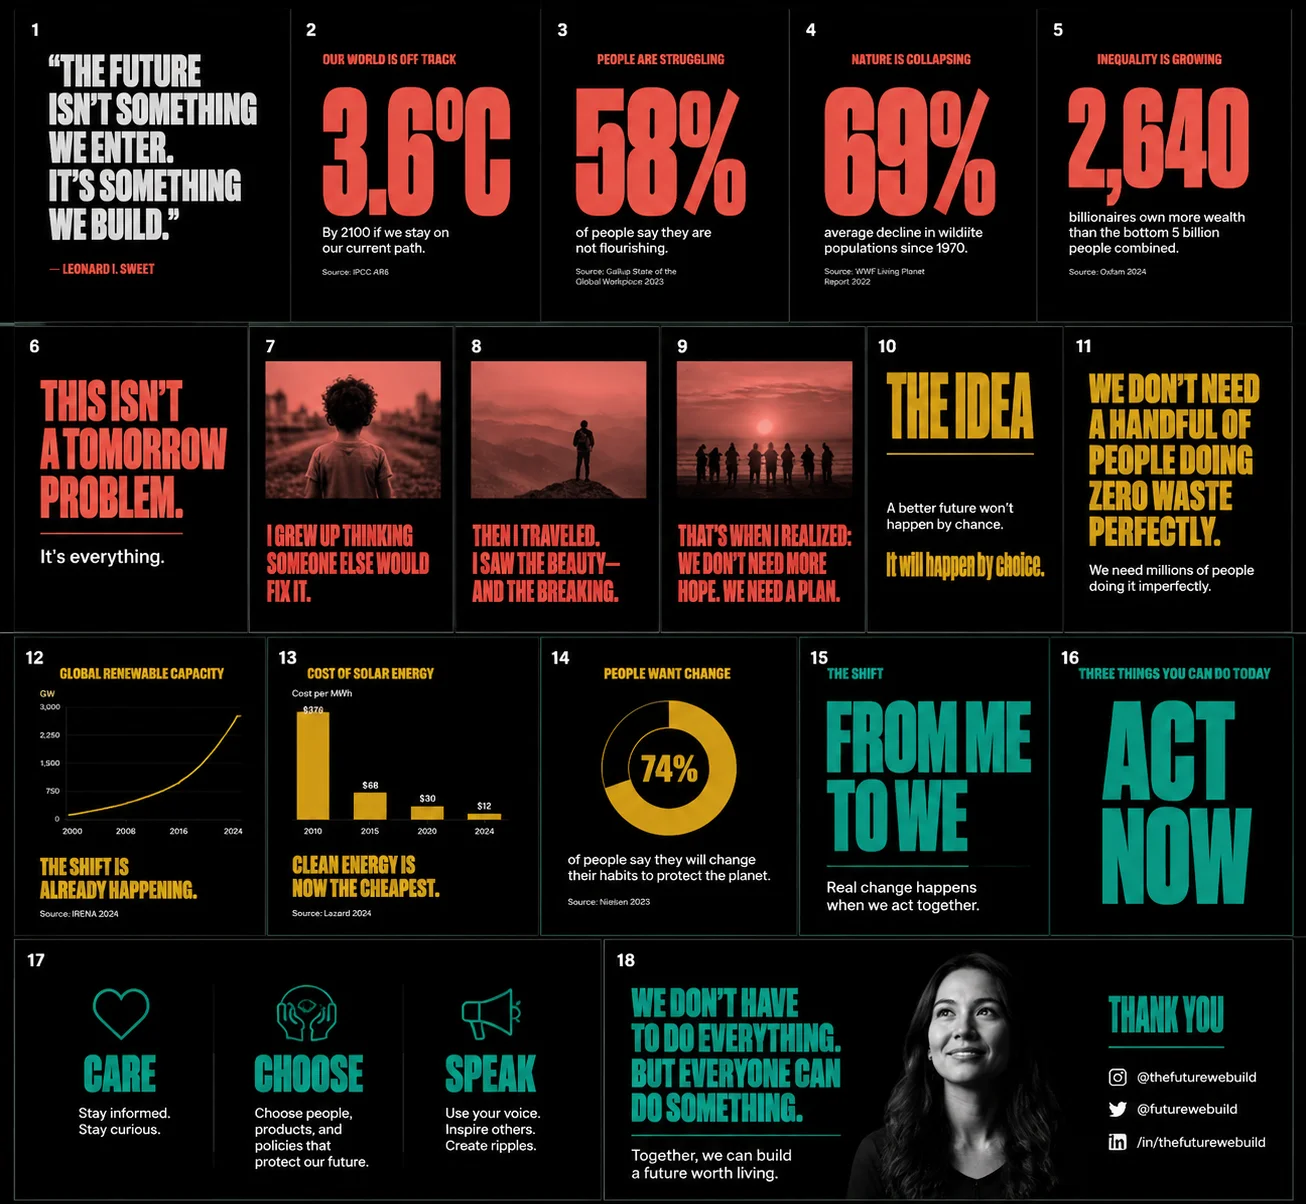
Generate a 18-slide TED-style inspirational keynote presentation. Bold editorial design: black background #111111, single vivid accent color that changes per section (coral → gold → teal), giant typographic headlines. Opening: full-screen quote in 72pt white text. Problem framing: 4 slides with one arresting statistic per slide — huge number, small context text. Story arc: 3 slides for a personal narrative with photo placeholders. The Idea: 2 slides explaining the core insight in plain language. Evidence: 3 data slides — one chart each, labeled simply. Call to Action: 2 slides — the shift required, and 3 things the audience can do today. Closing: memorable one-sentence manifesto + speaker photo + social handles. No bullet points anywhere. Every slide communicates ONE idea. Font: Obviously or Druk for display, GT America for body. Tone: urgent, emotional, memorable.
市場調查
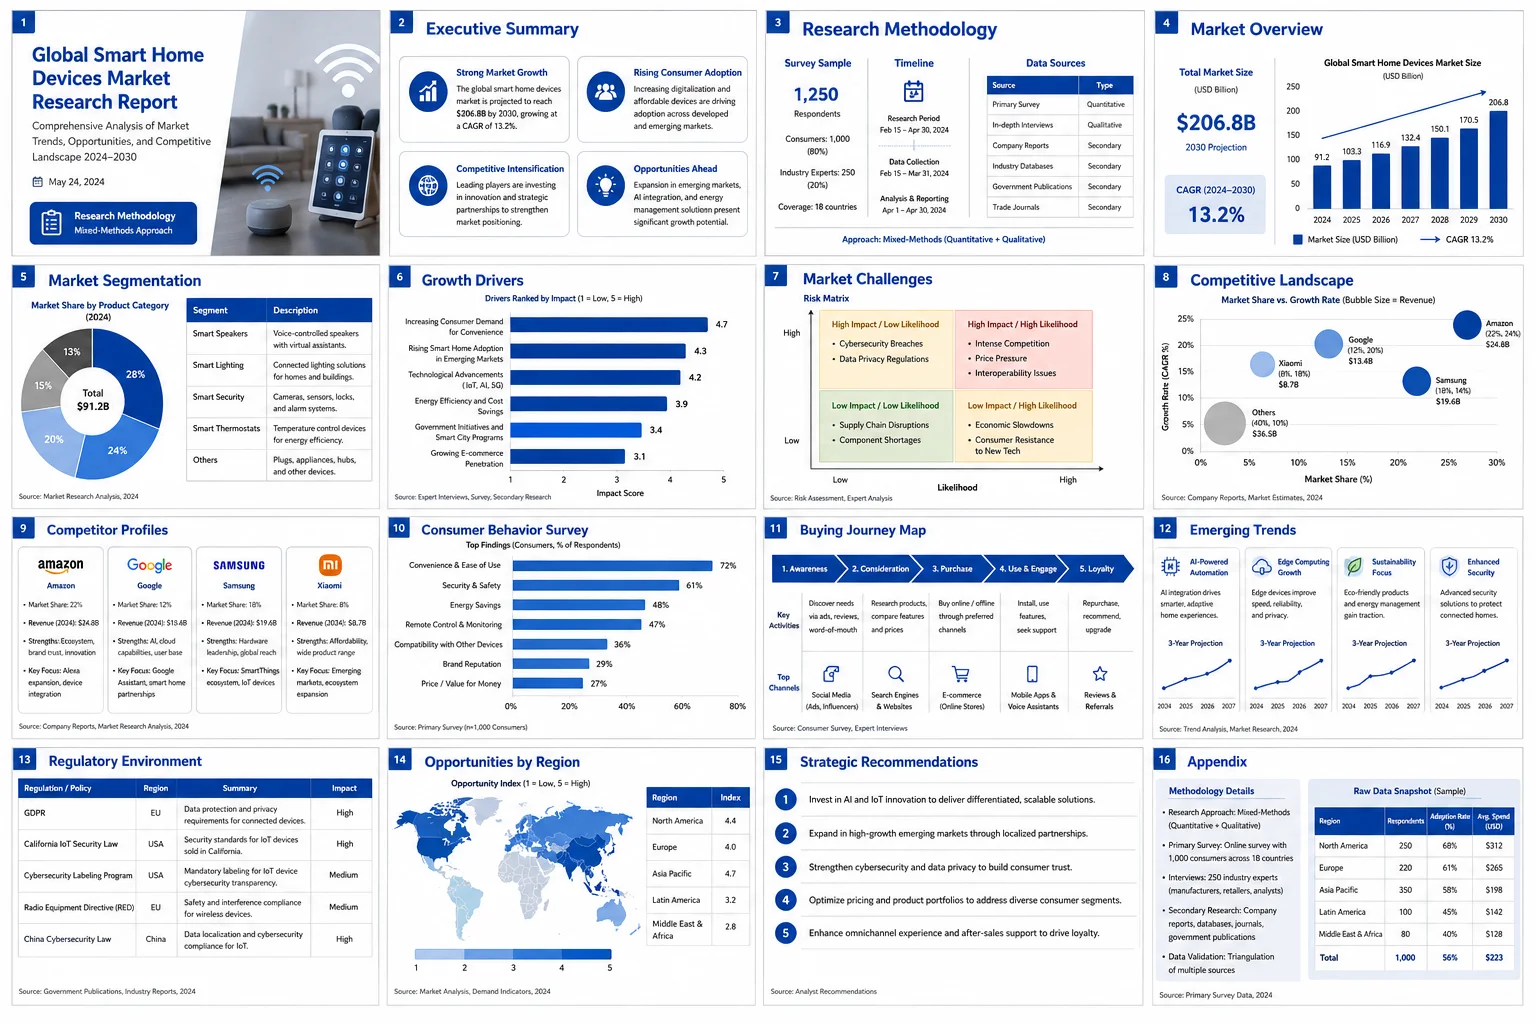
Create a 16-slide market research report presentation. Clean corporate style: white background, professional blue #0047AB, 12px grid layout. Slide 1: Report title, date, research methodology badge. Slide 2: Executive Summary — 4 key findings in large callout boxes. Slide 3: Research Methodology — survey sample, timeline, data sources table. Slide 4: Market Overview — total market size + CAGR chart. Slide 5: Market Segmentation — donut chart + description table. Slide 6: Growth Drivers — horizontal bar chart ranked by impact. Slide 7: Market Challenges — risk matrix 2×2. Slide 8: Competitive Landscape — bubble chart (market share vs. growth rate, bubble = revenue). Slide 9: Competitor Profiles — 4 mini-profile cards. Slide 10: Consumer Behavior Survey — bar chart top findings. Slide 11: Buying Journey Map — horizontal stage diagram with channel labels. Slide 12: Emerging Trends — 4 trend cards with 3-year projection sparklines. Slide 13: Regulatory Environment — summary table. Slide 14: Opportunities by Region — world heat map. Slide 15: Strategic Recommendations — numbered action list. Slide 16: Appendix — methodology detail, raw data tables. Font: Calibri headings, Arial body. Tone: objective, analytical, evidence-based.
新人培訓
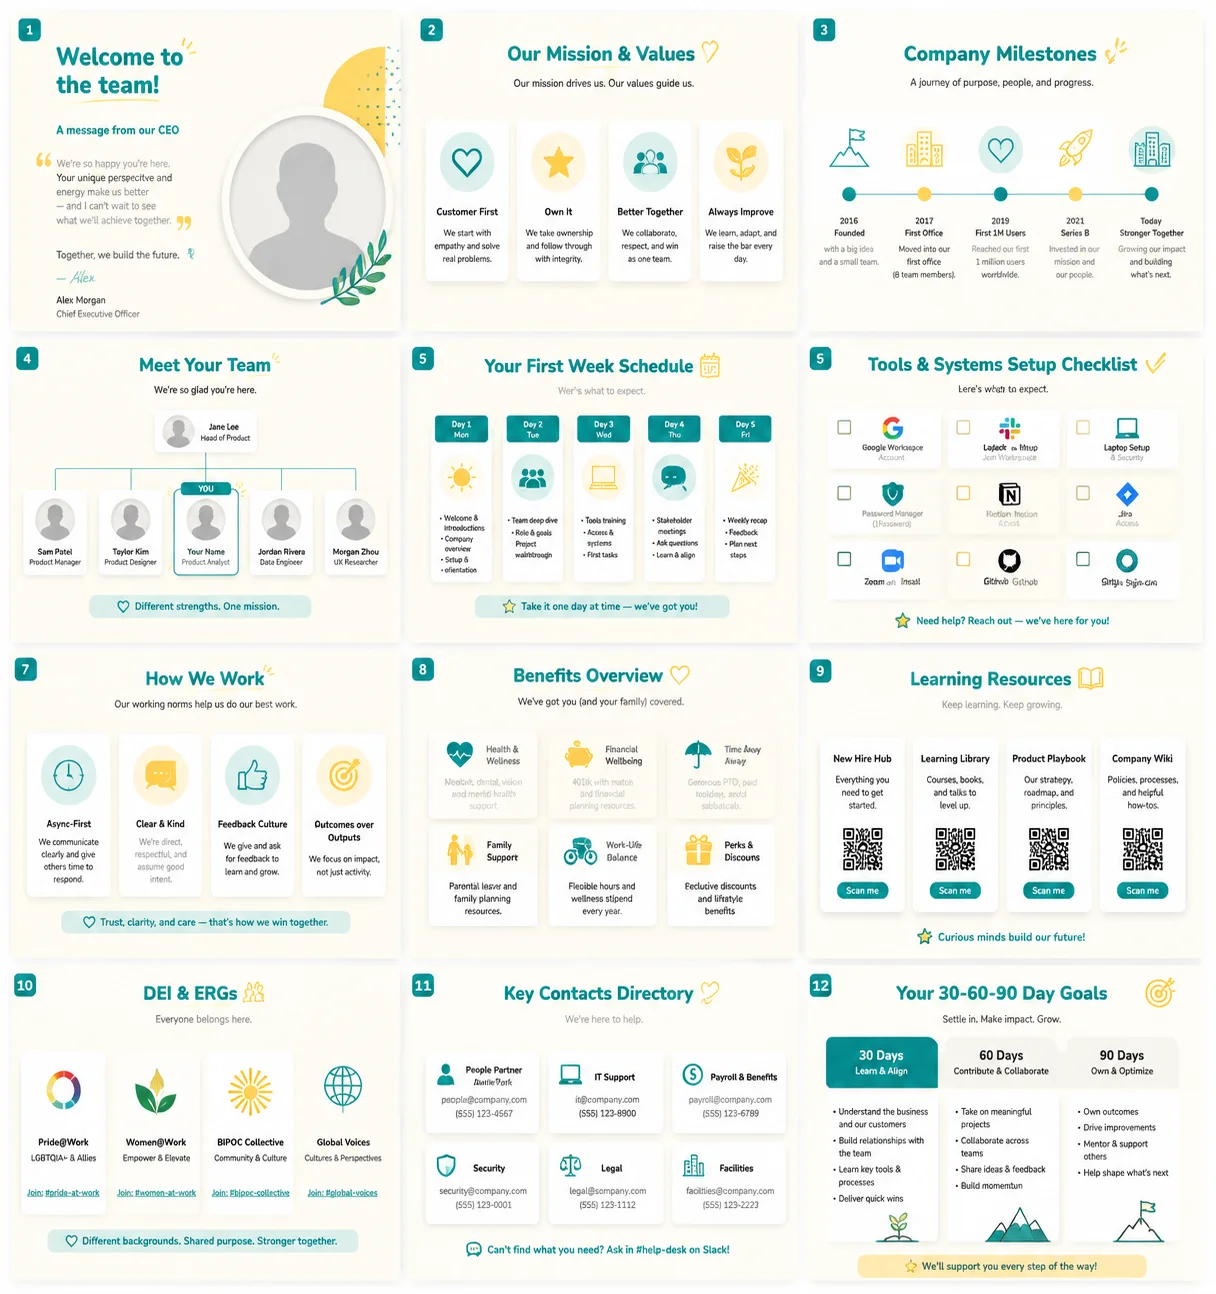
Build a 12-slide new employee onboarding deck. Warm and welcoming style: off-white #FFFEF7 background, warm teal #0D9488 + sunny yellow #FCD34D accents. Slide 1: Welcome message from CEO with photo placeholder and personal quote. Slide 2: Our Mission & Values — 4 value cards with icons and one-line descriptions. Slide 3: Company Milestones — illustrated horizontal timeline from founding to today. Slide 4: Meet Your Team — org chart section with headshots placeholder, showing new hire's position highlighted. Slide 5: Your First Week Schedule — day-by-day calendar card layout. Slide 6: Tools & Systems Setup Checklist — icon grid with checkboxes. Slide 7: How We Work — working norms (async-first, feedback culture) as a visual card set. Slide 8: Benefits Overview — 6 benefit category icons with one-line summary each. Slide 9: Learning Resources — 4 resource cards with QR placeholders. Slide 10: DEI & ERGs — group logos and join links. Slide 11: Key Contacts Directory — role-based contact cards. Slide 12: Your 30-60-90 Day Goals — tabbed milestone plan. Font: Nunito. Tone: warm, human, energizing.
財報發布
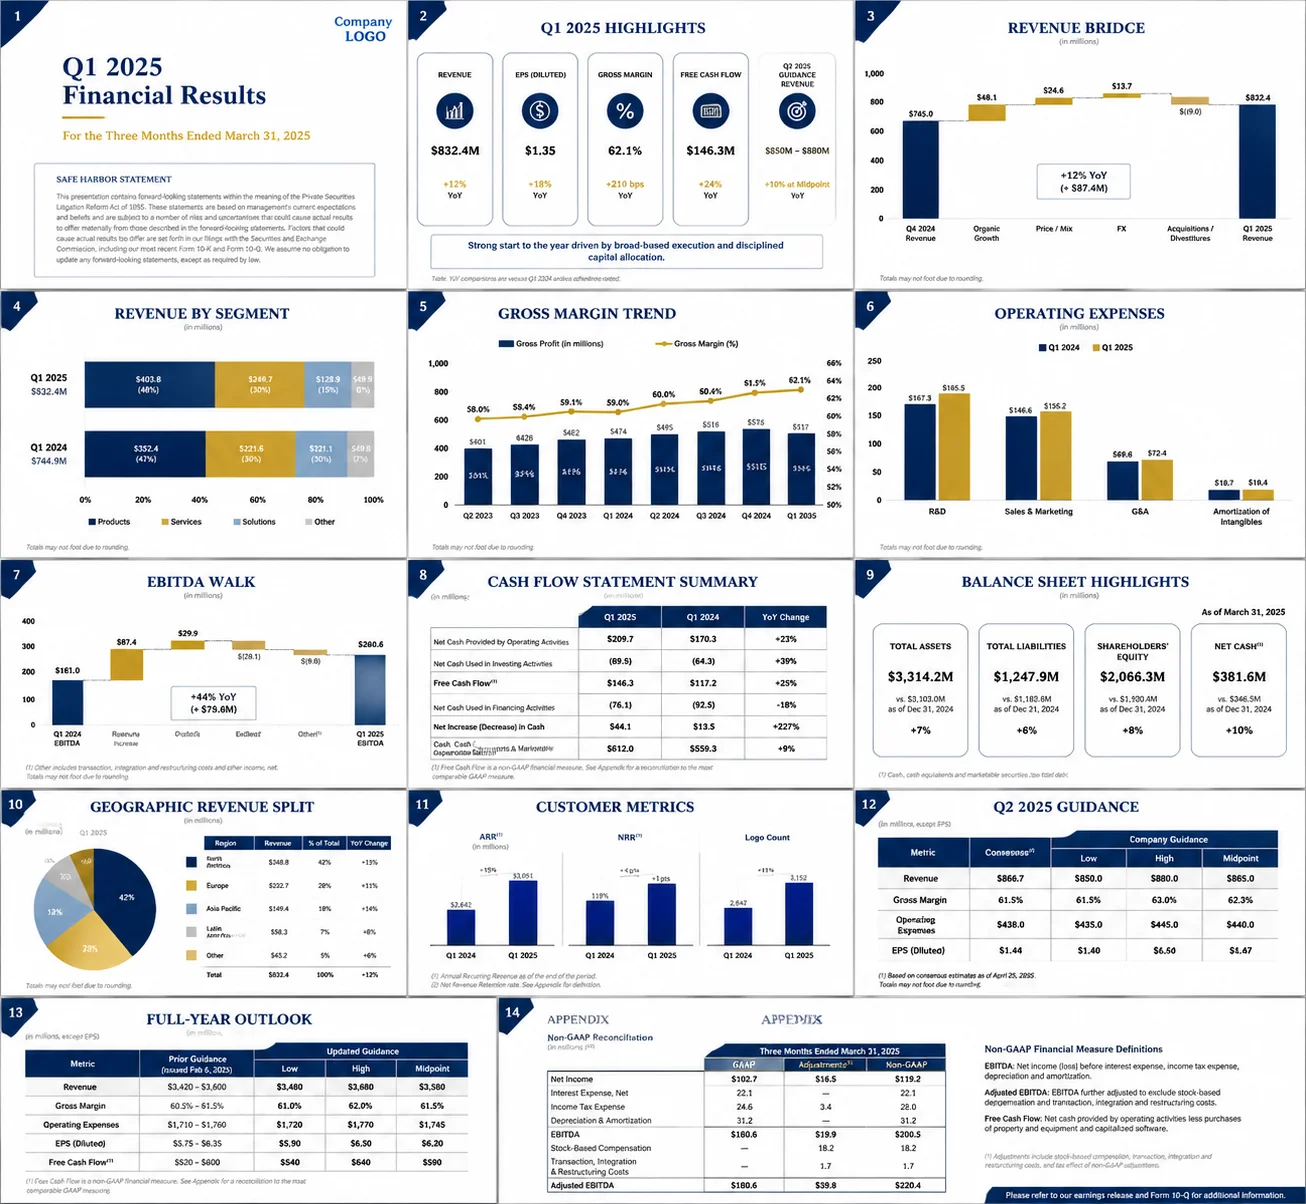
Design a 14-slide Q1 2025 financial earnings results presentation for a public company. Formal corporate style: white background, deep navy #001F5B primary, gold #C8A951 accent. Slide 1: Quarter summary title, fiscal date, safe harbor statement. Slide 2: Q1 Highlights — 5 headline metrics in large number cards (Revenue, EPS, Gross Margin, FCF, Guidance). Slide 3: Revenue Bridge — waterfall chart from Q4 2024 to Q1 2025. Slide 4: Revenue by Segment — horizontal stacked bar with prior year comparison. Slide 5: Gross Margin Trend — dual-axis line+bar chart over 8 quarters. Slide 6: Operating Expenses — grouped bar chart by category. Slide 7: EBITDA Walk — waterfall chart. Slide 8: Cash Flow Statement Summary — 3-column table. Slide 9: Balance Sheet Highlights — asset/liability card summary. Slide 10: Geographic Revenue Split — regional pie chart + table. Slide 11: Customer Metrics — ARR, NRR, logo count trend charts. Slide 12: Q2 2025 Guidance — range table with consensus vs. guidance. Slide 13: Full-Year Outlook — updated annual guidance table. Slide 14: Appendix — reconciliation tables, non-GAAP definitions. Font: Times New Roman headings, Calibri body. Tone: precise, compliance-minded, investor-grade.
設計系統
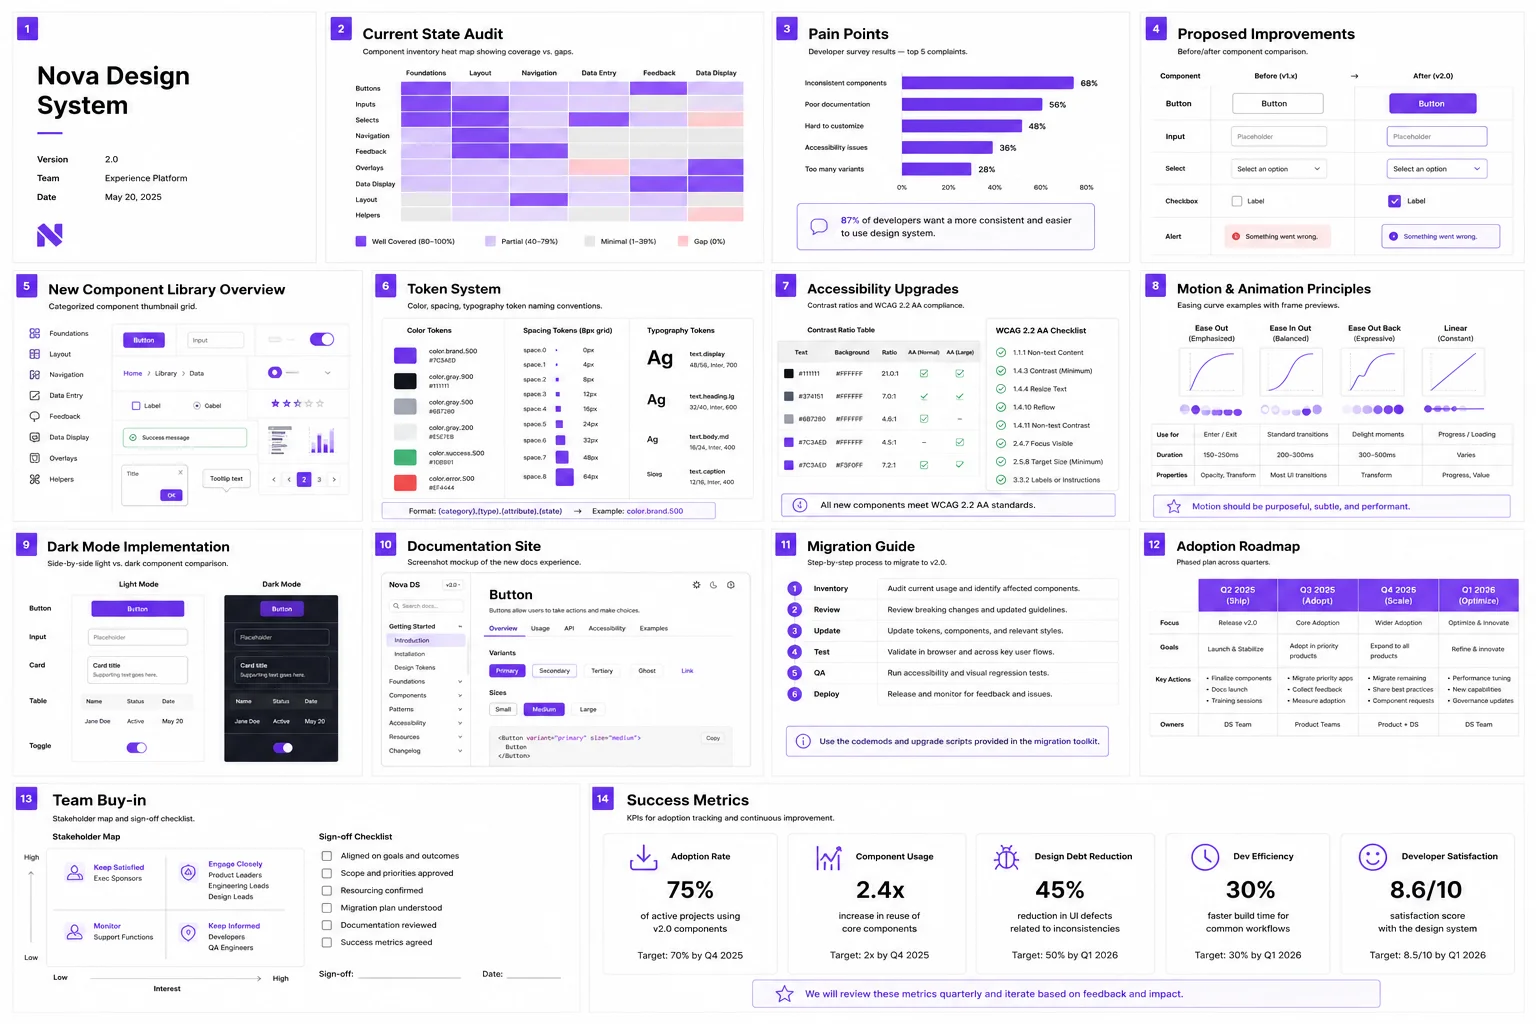
Create a 14-slide design system review and proposal presentation. Ultra-minimal design: pure white #FFFFFF background, 8px grid, jet black #111111 text, single electric purple #7C3AED accent for key elements. Slide 1: Design System name, version, team, date. Slide 2: Current State Audit — component inventory heat map showing coverage vs. gaps. Slide 3: Pain Points — developer survey results bar chart, top 5 complaints. Slide 4: Proposed Improvements — before/after component comparison grid (old vs. new). Slide 5: New Component Library Overview — categorized component thumbnail grid. Slide 6: Token System — color/spacing/typography token naming convention diagrams. Slide 7: Accessibility Upgrades — contrast ratio table, WCAG 2.2 AA compliance checklist. Slide 8: Motion & Animation Principles — easing curve examples with frame previews. Slide 9: Dark Mode Implementation — side-by-side light/dark component comparison. Slide 10: Documentation Site — screenshot mockup. Slide 11: Migration Guide — step-by-step numbered process. Slide 12: Adoption Roadmap — phased quarterly plan. Slide 13: Team Buy-in — stakeholder map + sign-off checklist. Slide 14: Success Metrics — KPIs for adoption tracking. Font: Inter. Tone: precise, collaborative, forward-looking.
客戶案例
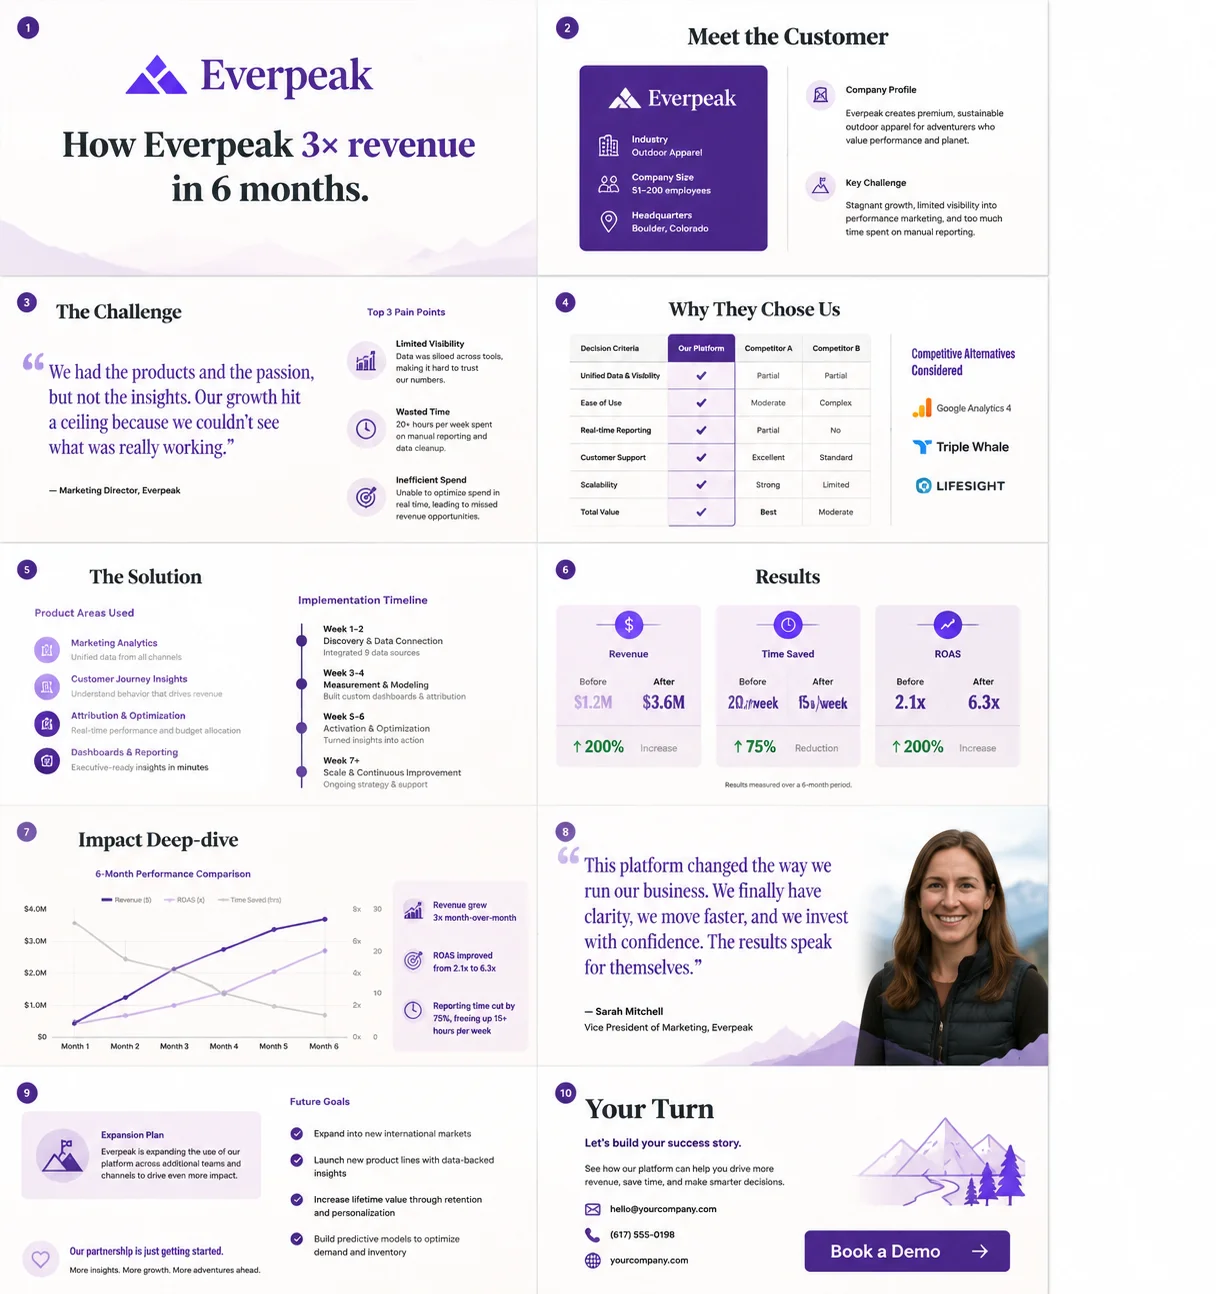
Build a 10-slide customer success story / case study presentation. Narrative storytelling style: warm white background, brand color of the featured customer, large pull quotes in 48pt type. Slide 1: Customer logo + headline result in one sentence ('How [Company] 3× revenue in 6 months'). Slide 2: Meet the Customer — company profile card, industry, size, key challenge. Slide 3: The Challenge — customer's words as a large testimonial quote, plus 3 pain points. Slide 4: Why They Chose Us — decision criteria table, competitive alternatives considered. Slide 5: The Solution — product areas used, implementation timeline. Slide 6: Results — 3 metric cards with before/after numbers and % improvement. Slide 7: Impact Deep-dive — supporting chart (revenue, time saved, etc.). Slide 8: Team Quote — full-page quote from their VP/Director with headshot. Slide 9: What's Next — customer's expansion plan and future goals. Slide 10: Your Turn — CTA to book a demo, contact details, next step button. Font: Georgia headings, Inter body. Tone: authentic, outcome-focused, persuasive.
董事會簡報
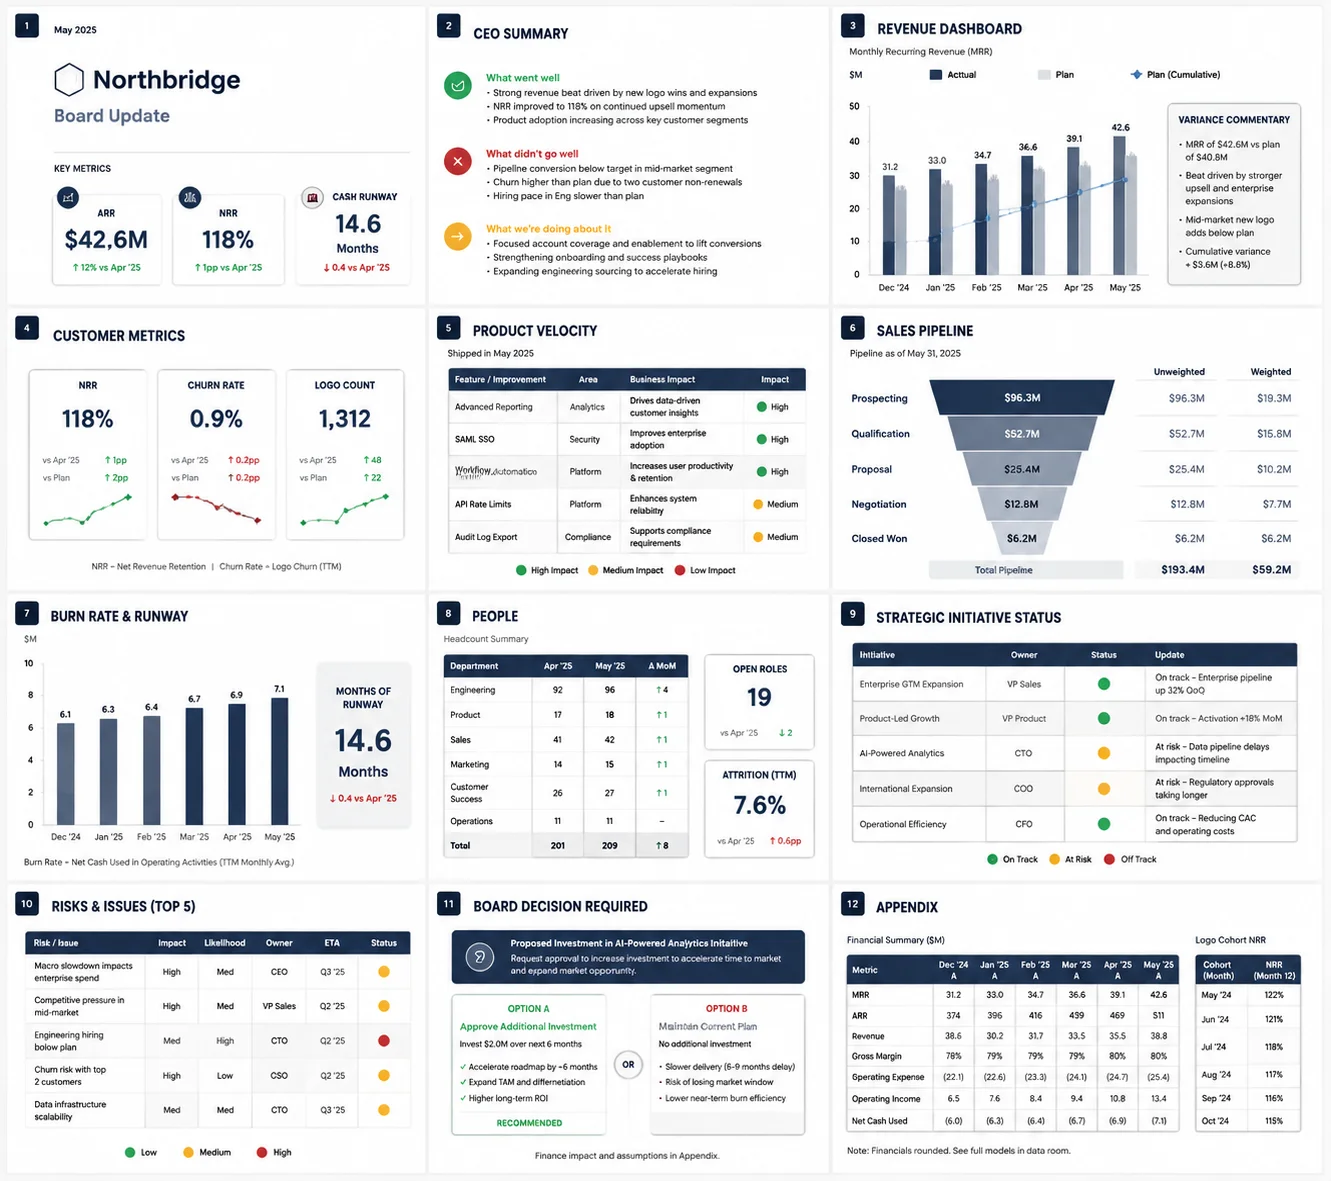
Design a 12-slide monthly board packet update presentation. Executive minimalist style: clean white, slate grey #475569 secondary, accent dot indicators in red/amber/green for status. Slide 1: Month/Year, company name, key metrics banner (3 large KPI numbers). Slide 2: CEO Summary — three bullet narrative: what went well, what didn't, what we're doing about it. Slide 3: Revenue Dashboard — actuals vs. plan bar chart + trend line, variance commentary box. Slide 4: Customer Metrics — NRR, churn rate, logo count vs. last month + plan. Slide 5: Product Velocity — shipped items table with business impact tags. Slide 6: Sales Pipeline — stage-by-stage funnel chart, weighted vs. unweighted. Slide 7: Burn Rate & Runway — monthly bar chart + months of runway callout. Slide 8: People — headcount table, open roles, attrition rate. Slide 9: Strategic Initiative Status — 5-row RAG status table. Slide 10: Risks & Issues — risk register top 5 with owner and ETA. Slide 11: Board Decision Required — clearly highlighted item with two-option framing. Slide 12: Appendix — detailed financial tables, cohort data. Font: Inter. Tone: concise, transparent, decision-facilitating.
領導力培訓
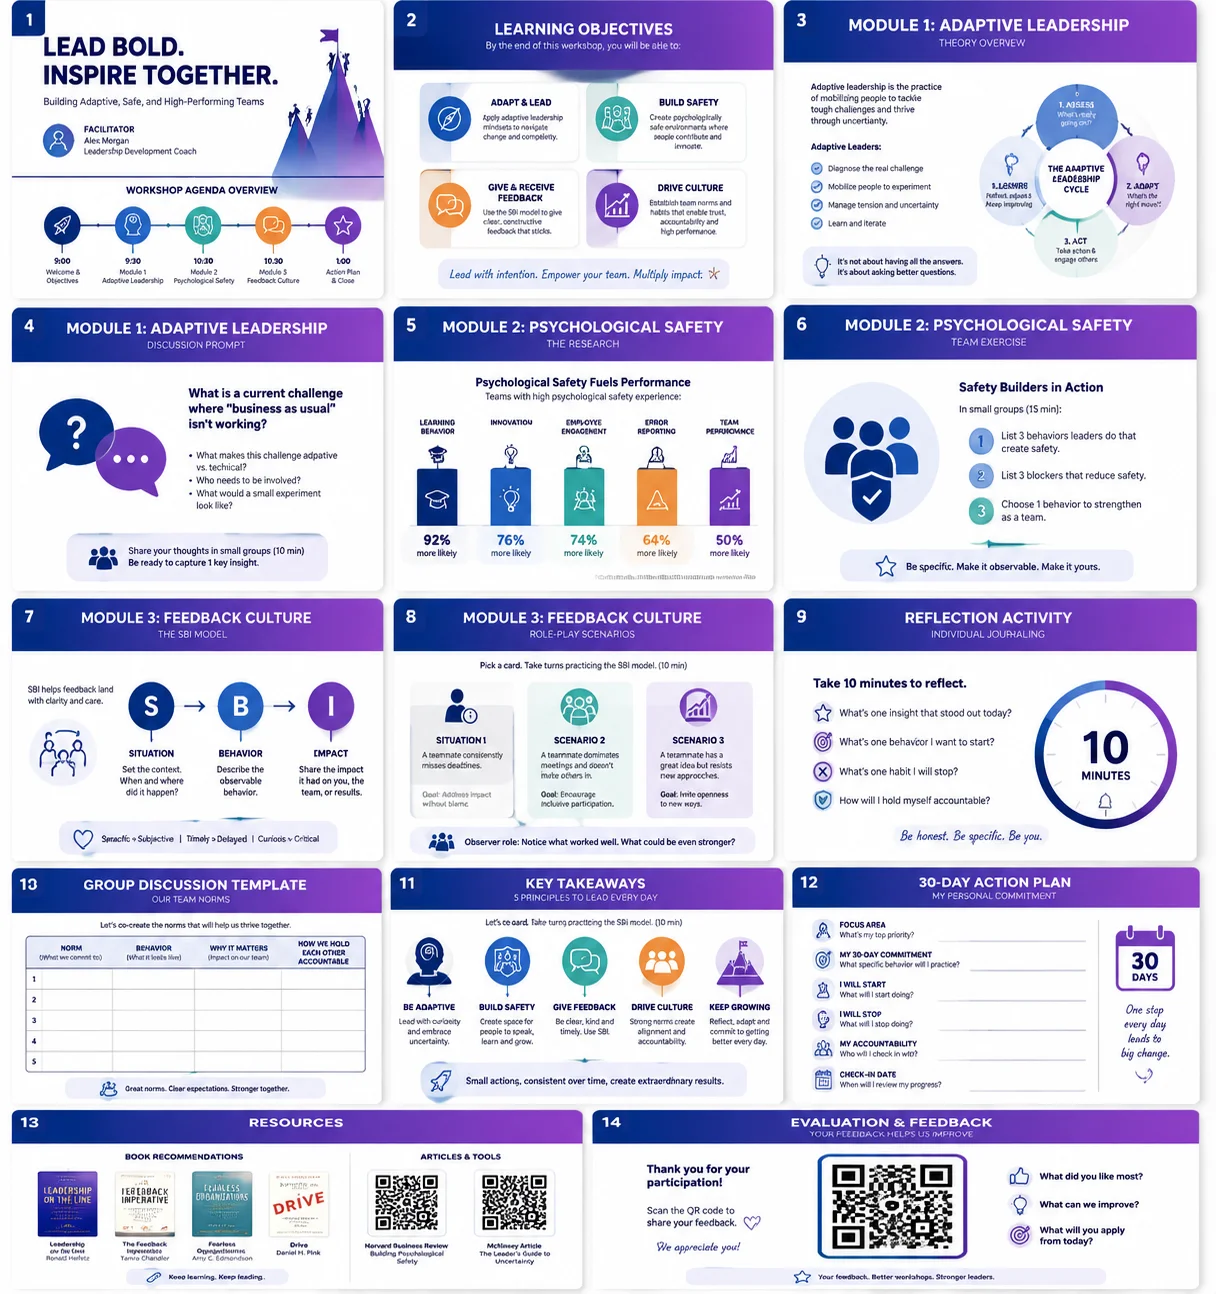
Create a 14-slide corporate leadership training workshop presentation. Energetic modern style: gradient section headers (dark blue → purple), white content areas, large workshop activity icons. Slide 1: Workshop title, facilitator name, agenda overview timeline. Slide 2: Learning Objectives — 4 skill outcome cards with icons. Slides 3-4: Module 1 — Adaptive Leadership (theory overview, then interactive discussion prompt). Slides 5-6: Module 2 — Psychological Safety (research summary chart, team exercise instructions). Slides 7-8: Module 3 — Feedback Culture (SBI model diagram, role-play scenario cards). Slide 9: Reflection Activity — individual journaling prompt with timer graphic. Slide 10: Group Discussion Template — table format for capturing team norms. Slide 11: Key Takeaways — top 5 principles illustrated as icons with one-liners. Slide 12: 30-Day Action Plan template — personal commitment worksheet. Slide 13: Resources — book covers, article QR codes. Slide 14: Evaluation & Feedback QR code. Font: Raleway headings, Open Sans body. Tone: energizing, practical, participatory.
市場進入策略
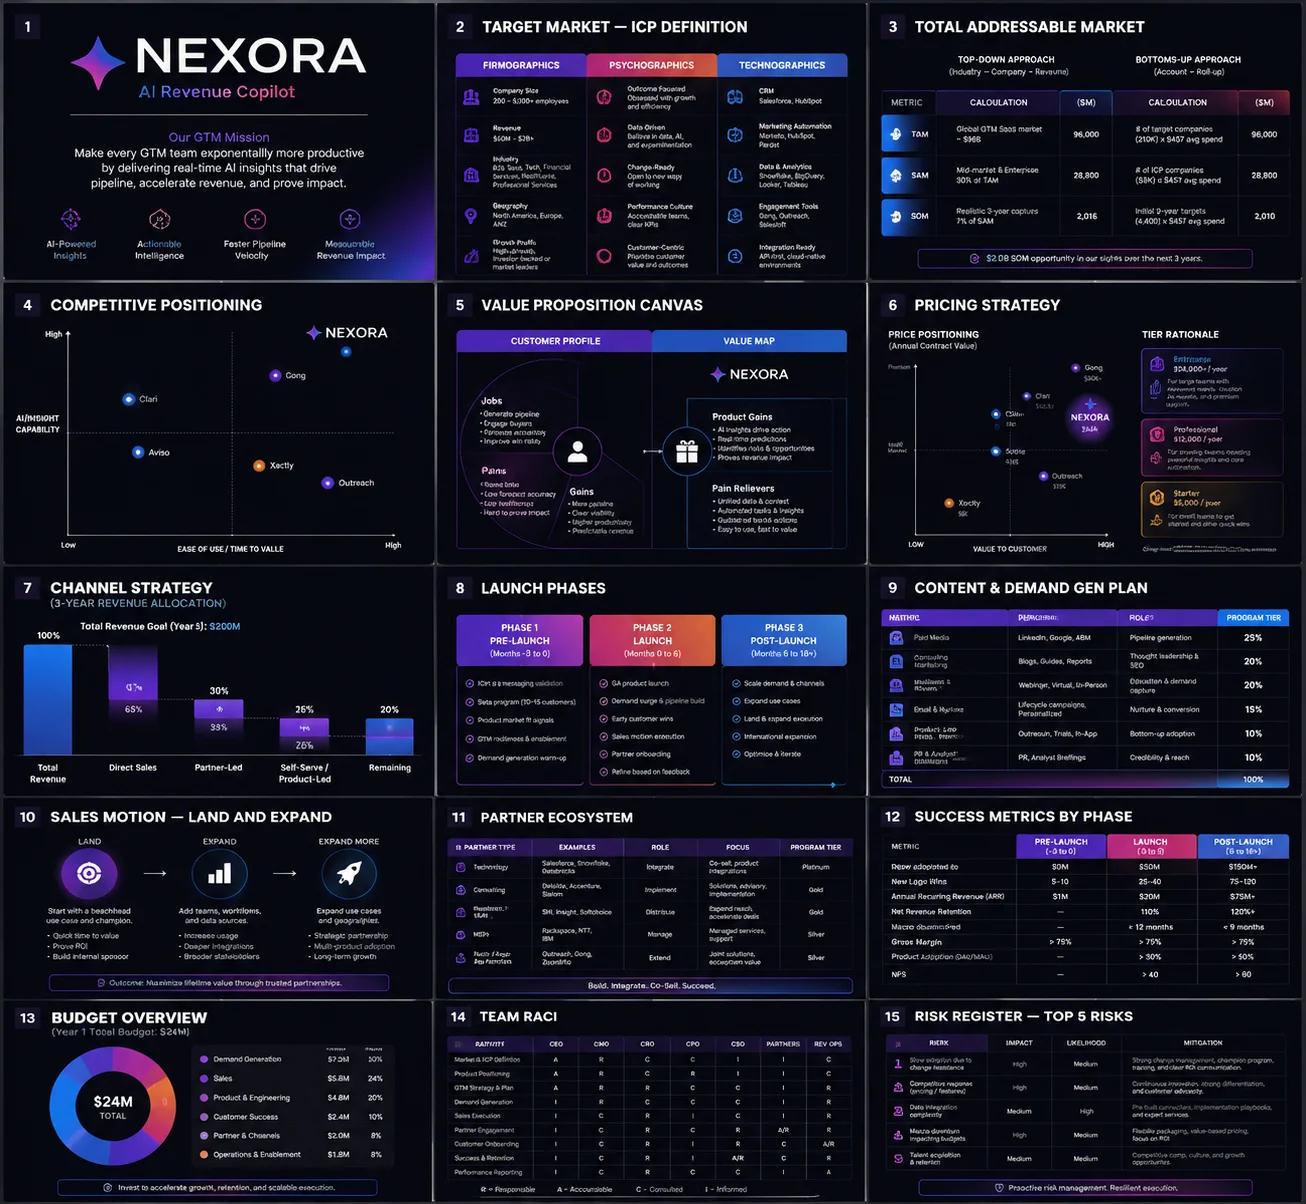
Build a 15-slide go-to-market (GTM) strategy presentation for a new product launch. Strategic style: dark charcoal #1C1C2E background, vibrant gradient accents, white text. Slide 1: Product name + GTM mission statement. Slide 2: Target Market — ICP definition table (firmographics + psychographics + technographics). Slide 3: Total Addressable Market — top-down and bottoms-up TAM/SAM/SOM comparison. Slide 4: Competitive Positioning — perceptual map with 6 competitors plotted. Slide 5: Value Proposition Canvas — customer jobs/pains/gains vs. product gains/pain relievers. Slide 6: Pricing Strategy — price positioning chart, tier rationale. Slide 7: Channel Strategy — direct vs. partner vs. self-serve allocation waterfall. Slide 8: Launch Phases — 3-phase horizontal timeline (Pre-launch, Launch, Post-launch) with milestones. Slide 9: Content & Demand Gen Plan — channel mix table with budget allocation. Slide 10: Sales Motion — land-and-expand diagram. Slide 11: Partner Ecosystem — partner type matrix. Slide 12: Success Metrics by Phase — KPI table per launch phase. Slide 13: Budget Overview — spend breakdown by function. Slide 14: Team RACI — responsibilities matrix. Slide 15: Risk Register — top 5 risks with mitigation. Font: Syne headings, Inter body. Tone: strategic, ambitious, cross-functional.
微服務
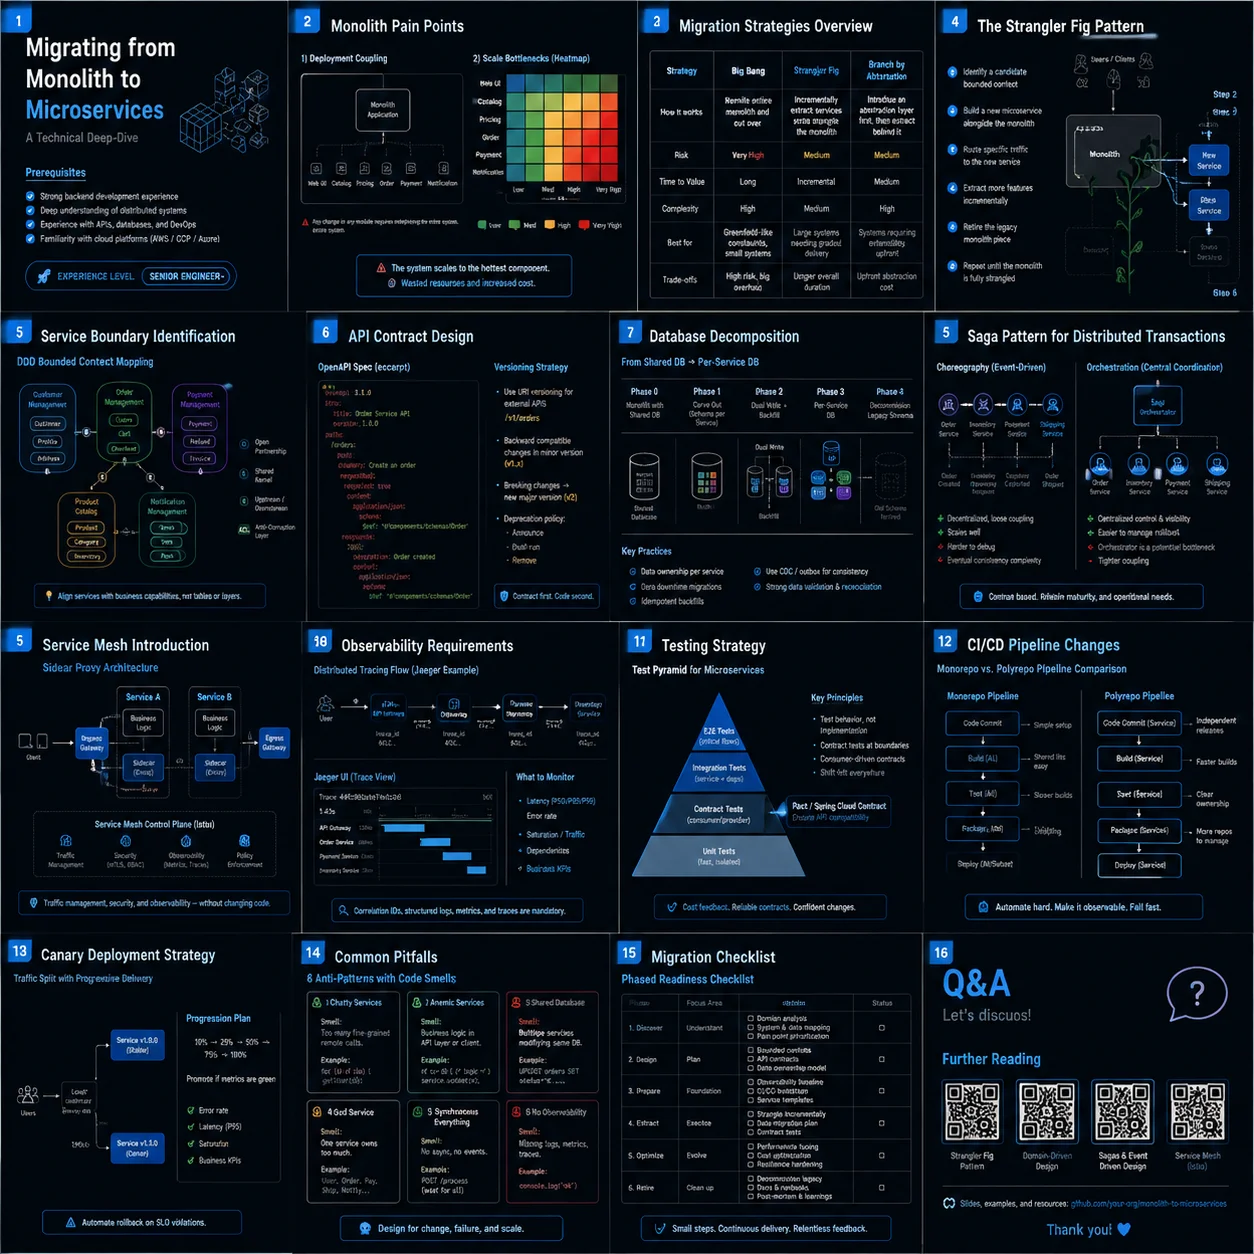
Generate a 16-slide technical deep-dive on migrating from monolith to microservices for senior engineers. Dark professional theme: #0F172A background, Tailwind-blue accent #38BDF8. Slide 1: Title + prerequisites (experience level badge). Slide 2: Monolith Pain Points — deployment coupling diagram, scale bottlenecks heatmap. Slide 3: Migration Strategies Overview — Big Bang vs. Strangler Fig vs. Branch by Abstraction comparison table. Slide 4: The Strangler Fig Pattern — step-by-step annotated diagram. Slide 5: Service Boundary Identification — DDD bounded context mapping diagram. Slide 6: API Contract Design — OpenAPI spec snippet, versioning strategy. Slide 7: Database Decomposition — shared DB → per-service DB migration phases. Slide 8: Saga Pattern for Distributed Transactions — choreography vs. orchestration comparison. Slide 9: Service Mesh Introduction — sidecar proxy diagram. Slide 10: Observability Requirements — distributed tracing flow with Jaeger example. Slide 11: Testing Strategy — test pyramid adapted for microservices, contract testing highlighted. Slide 12: CI/CD Pipeline Changes — monorepo vs. polyrepo pipeline comparison. Slide 13: Canary Deployment Strategy — traffic split diagram. Slide 14: Common Pitfalls — 6 anti-patterns with code smell examples. Slide 15: Migration Checklist — phased readiness checklist table. Slide 16: Q&A + further reading QR codes. Font: Fira Code + Inter. Tone: technical, pragmatic, battle-tested.
績效檢討
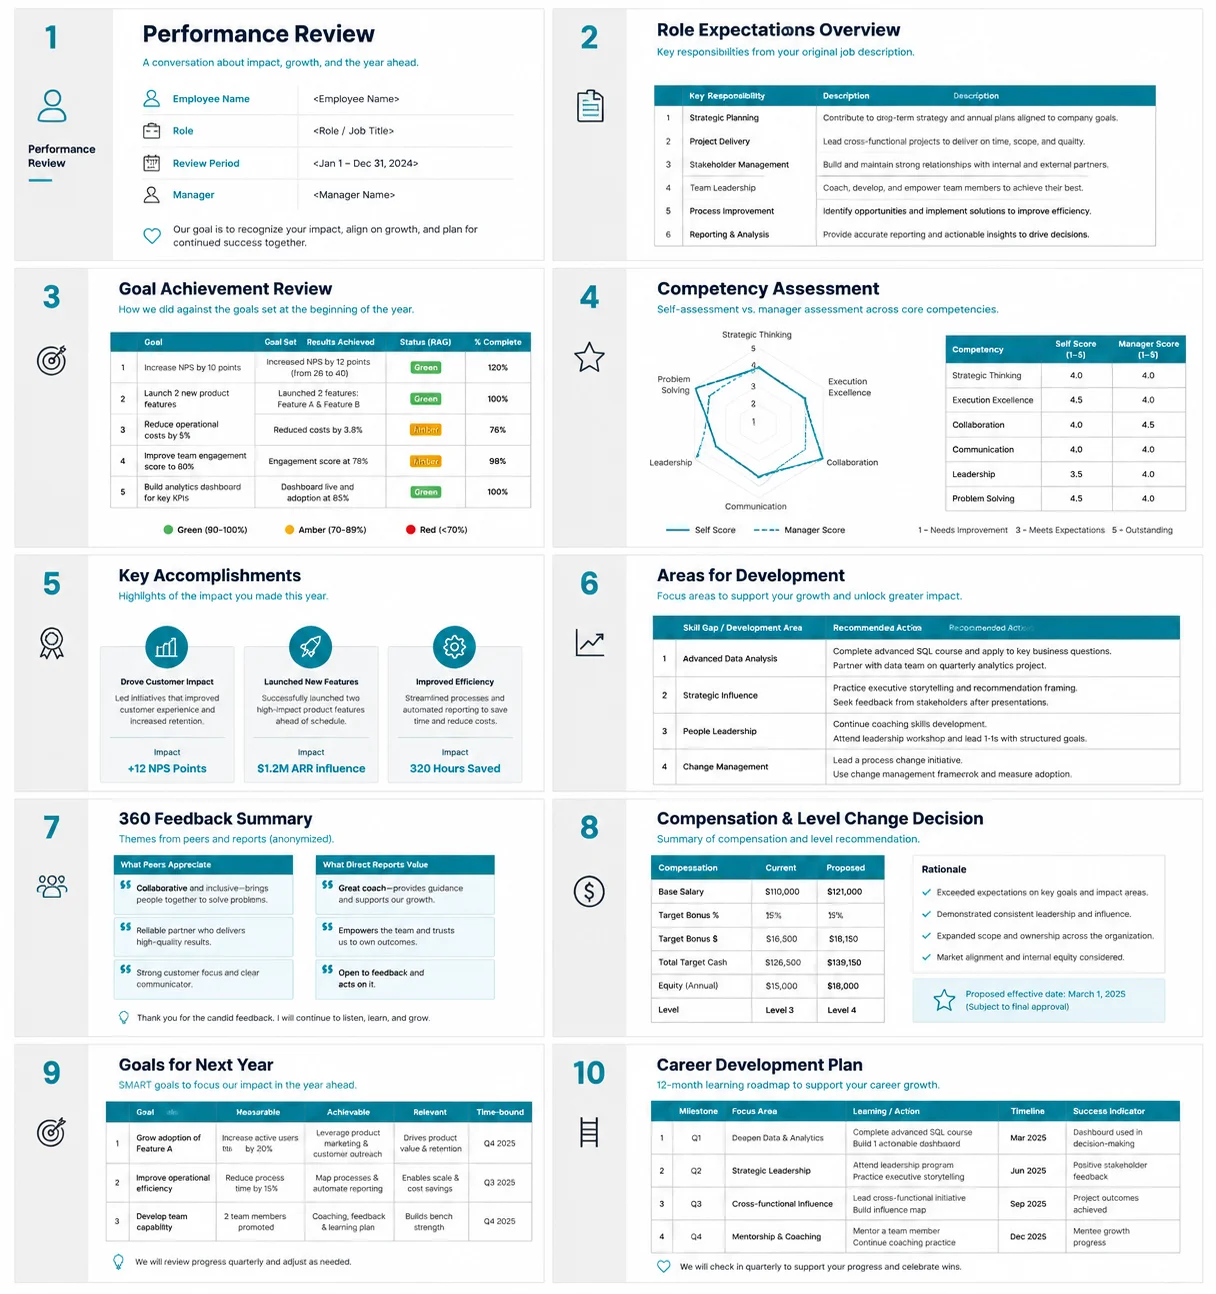
Create a 10-slide annual performance review presentation template for managers. Clean professional style: white background, subtle grey sidebar, teal #0891B2 accents. Slide 1: Employee name (placeholder), role, review period, manager name. Slide 2: Role Expectations Overview — original job description key responsibilities in a table. Slide 3: Goal Achievement Review — goals set vs. results achieved table with RAG status and % complete. Slide 4: Competency Assessment — radar chart covering 6 core competencies with self-score vs. manager-score overlay. Slide 5: Key Accomplishments — 3 featured achievement cards with impact metric. Slide 6: Areas for Development — 2-column table: skill gap + recommended action. Slide 7: 360 Feedback Summary — anonymized theme cards from peers and reports (verbatim quotes in quote boxes). Slide 8: Compensation & Level Change Decision — current vs. proposed comp table with rationale. Slide 9: Goals for Next Year — SMART goal template table (3 rows). Slide 10: Career Development Plan — 12-month learning roadmap with milestones. Font: Inter. Tone: fair, constructive, growth-oriented.
AI 趨勢
Design a 20-slide 'State of AI in 2025' trend report presentation. Editorial magazine style: rich black #0C0C0C background, white text, gold #E9B96E data highlights, full-bleed section cover slides. Cover: oversized typography, 'STATE OF AI 2025', subtitle, publisher logo. Section 1 — Foundation Models (4 slides): model landscape timeline, capability benchmark radar chart, cost-per-token trend line, open vs. closed model market share. Section 2 — Enterprise Adoption (4 slides): adoption rate by industry heat map, ROI survey results bar chart, implementation barriers ranking, top use case leaderboard. Section 3 — Workforce Impact (4 slides): job augmentation vs. displacement research summary, skills gap analysis, training investment trends, new AI-native role taxonomy. Section 4 — Regulation & Safety (3 slides): global regulation tracker map, safety incident database chart, red-teaming maturity model. Section 5 — What's Next (3 slides): 3 expert predictions with confidence scores, technology readiness levels, '5 things to do in 2025' action list. Back cover: methodology, citations. Font: Editorial New Display + Neue Haas Grotesk. Tone: authoritative, insightful, forward-looking.
Accenture Style
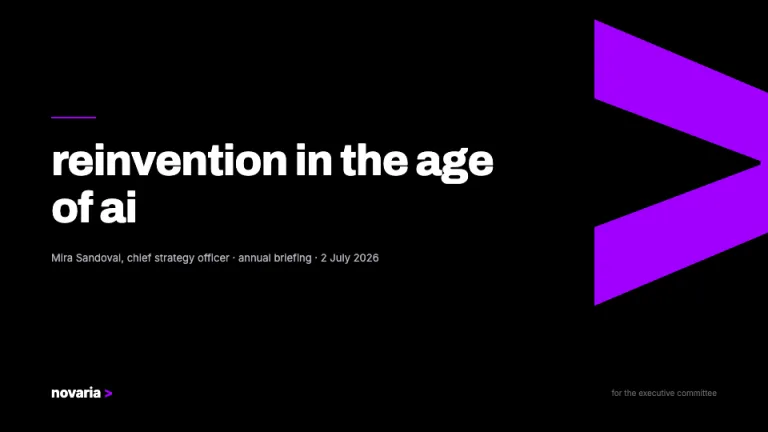
紫、黑,以及那個大於號
Arcade
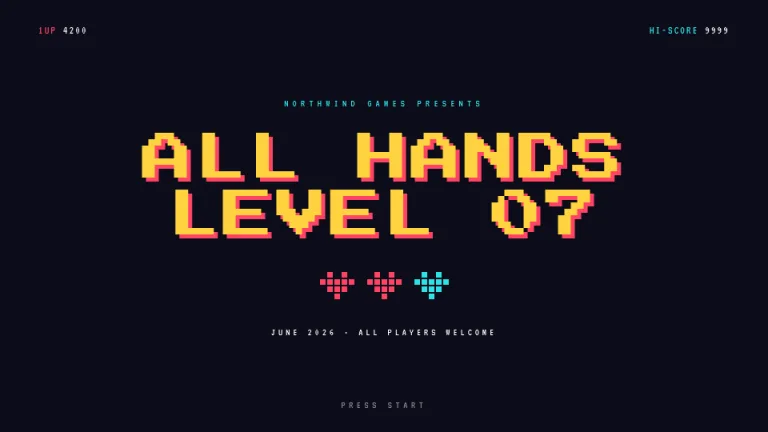
投幣開始
Art Deco
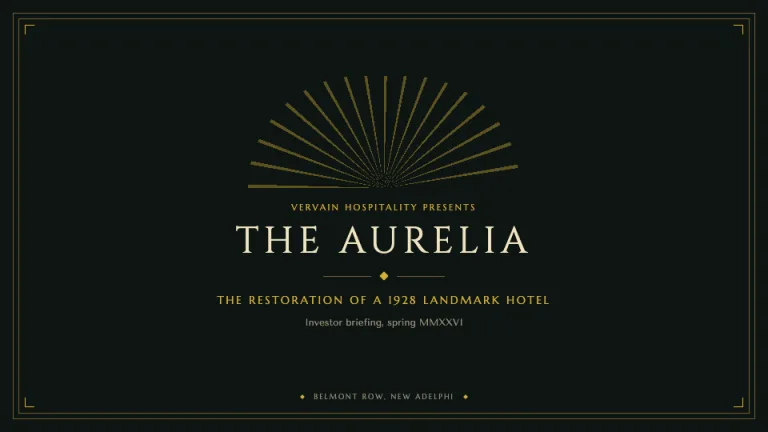
爵士年代的幾何鎏金
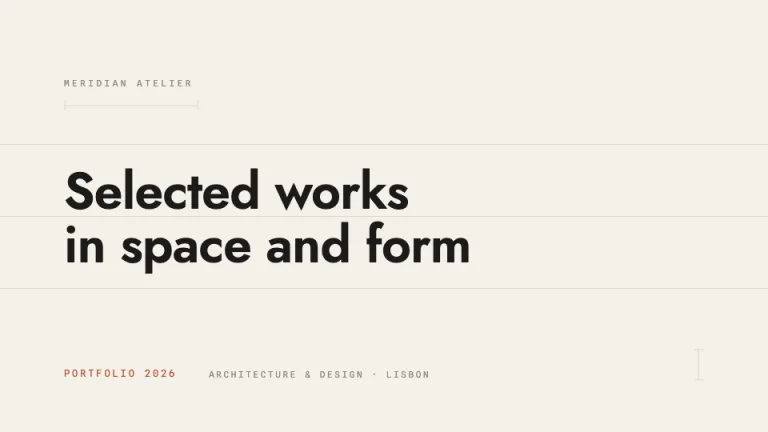
Atelier
像藍圖一樣精確
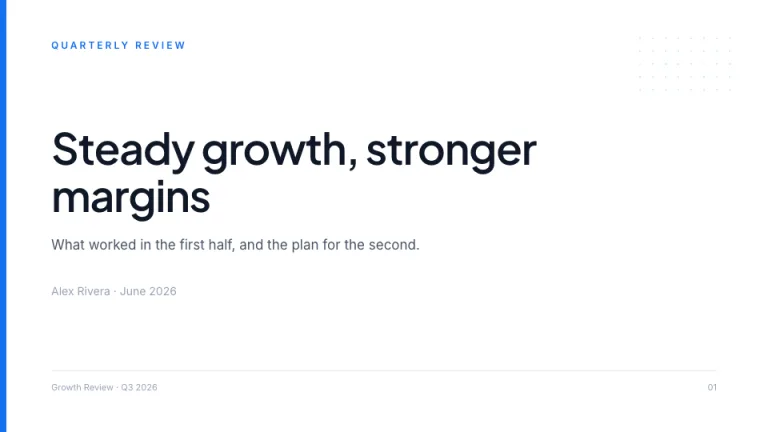
Atlas
最穩妥的那一版
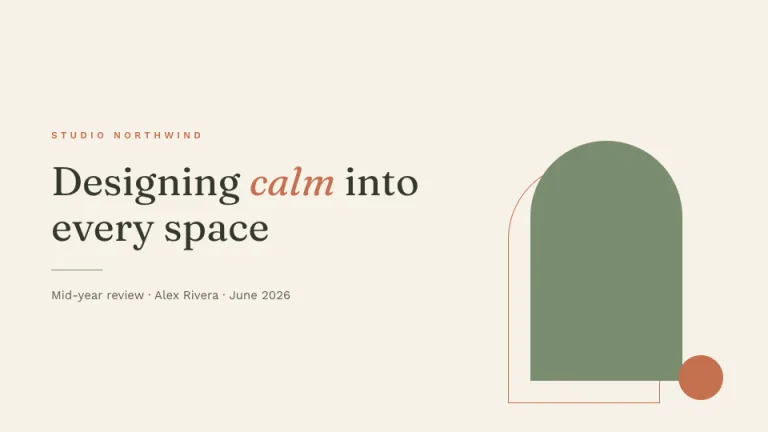
Atrium
如庭院般安靜
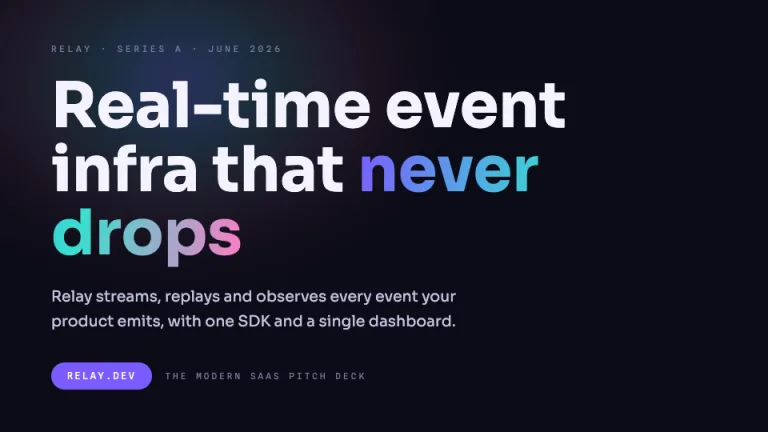
Aurora
為 SaaS 打造的漸層路演
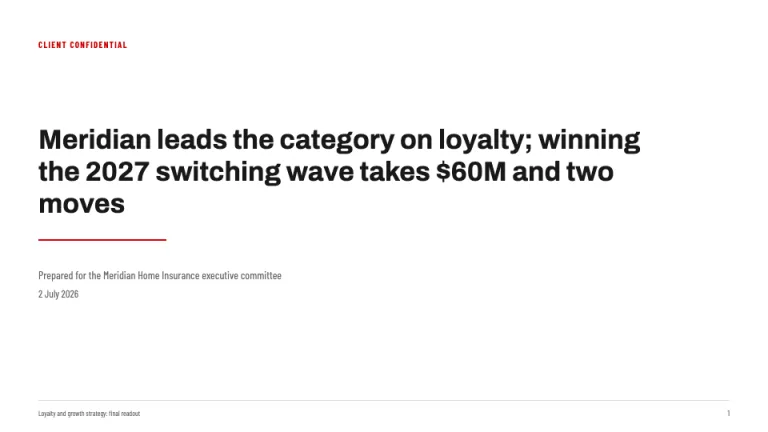
Bain Style
結論先行,重點標紅
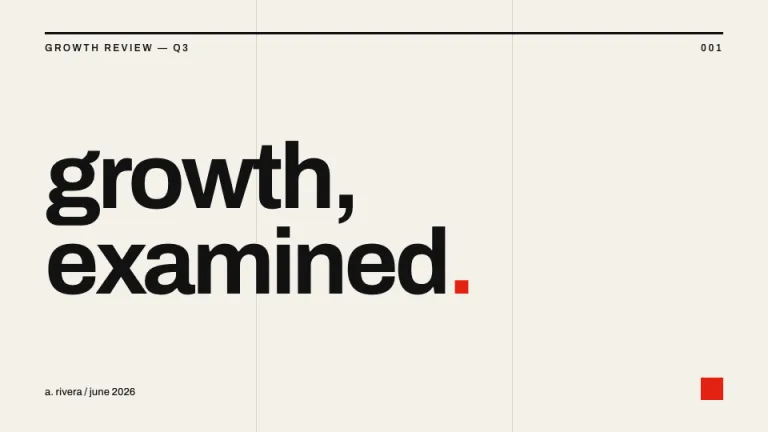
Basel
只靠字體喊話
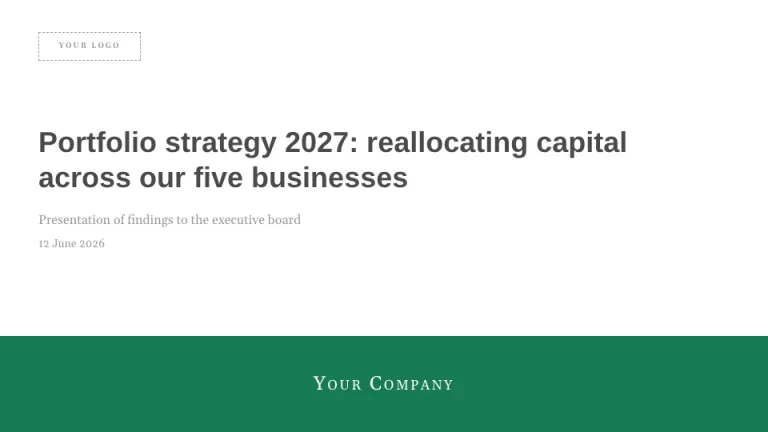
BCG Style
策略都在這個四象限裡
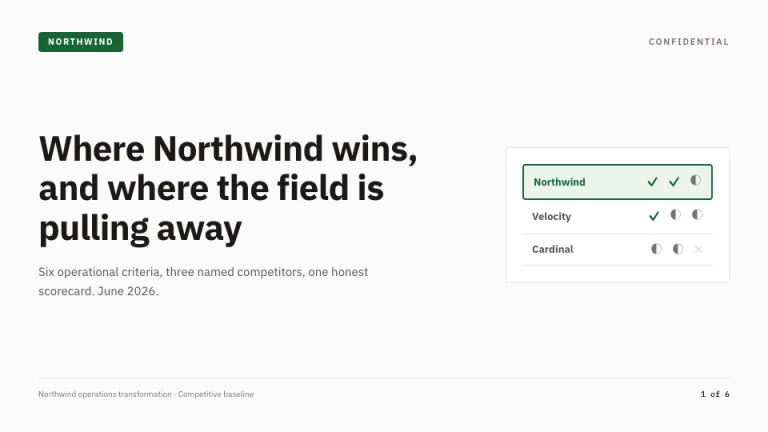
對標分析
我們對陣全場
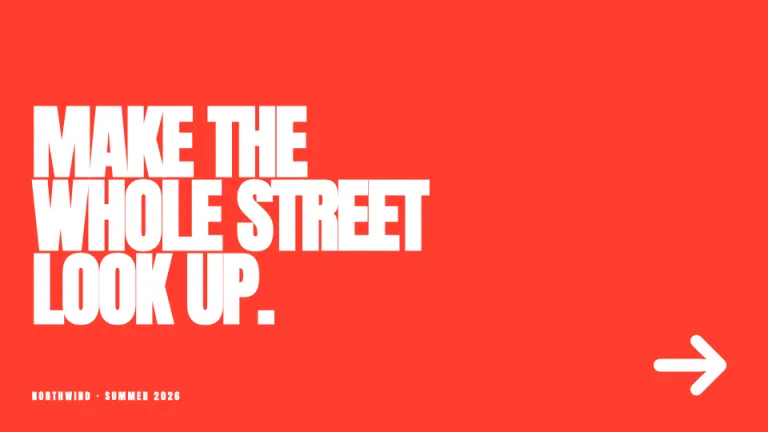
廣告看板
一種顏色,一句話
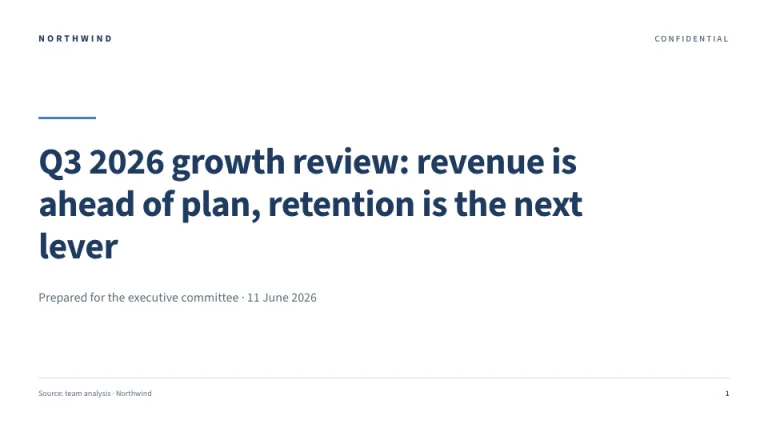
董事會議室
一頁簡報,就是一個論點
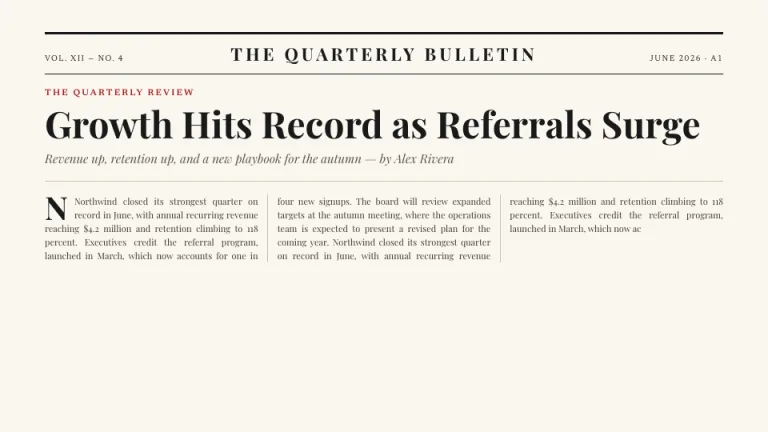
大報版式
頭條全都在這兒
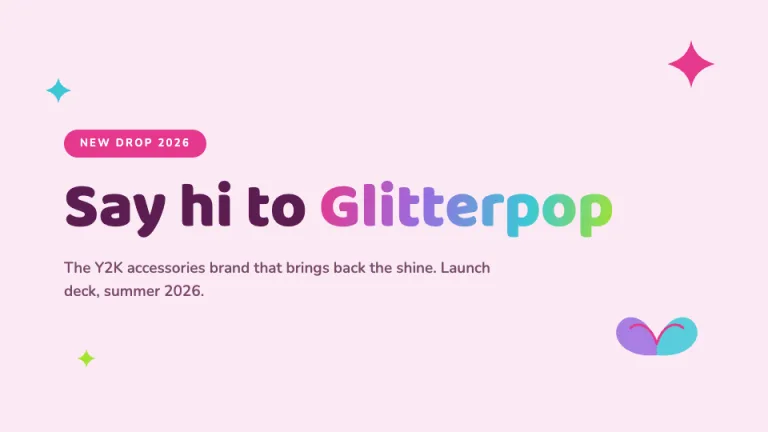
Bubblegum
千禧閃耀,但有章法
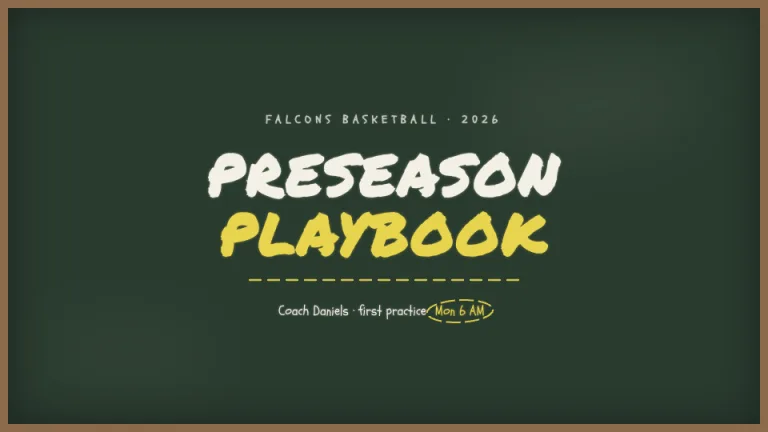
黑板
中場休息時畫的戰術板
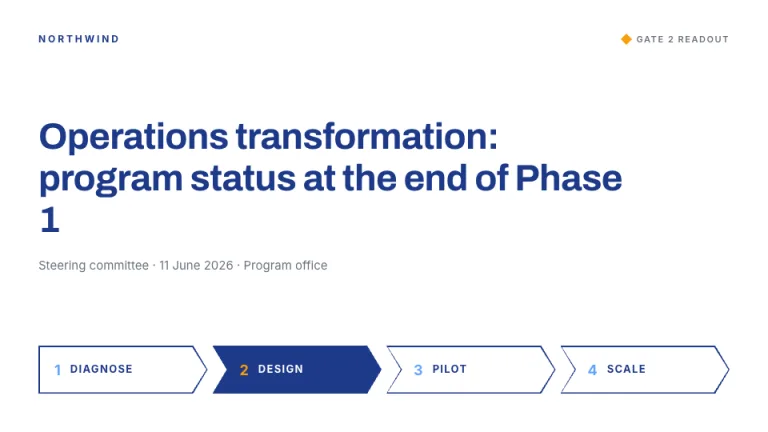
Chevron
四個階段,一個方向
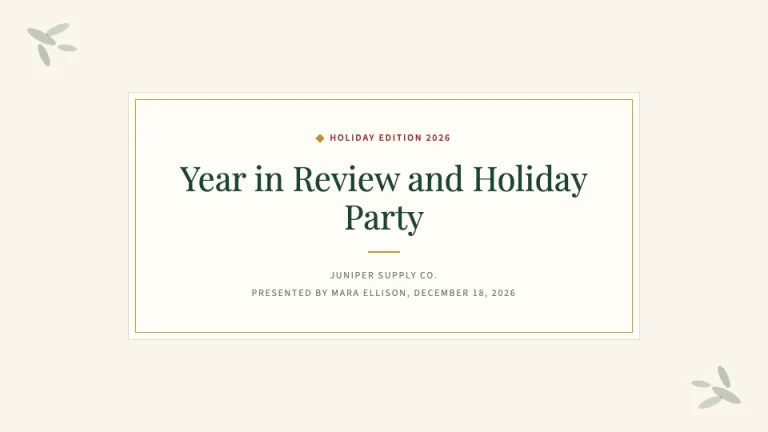
聖誕
節慶質感,拒絕俗氣剪貼畫
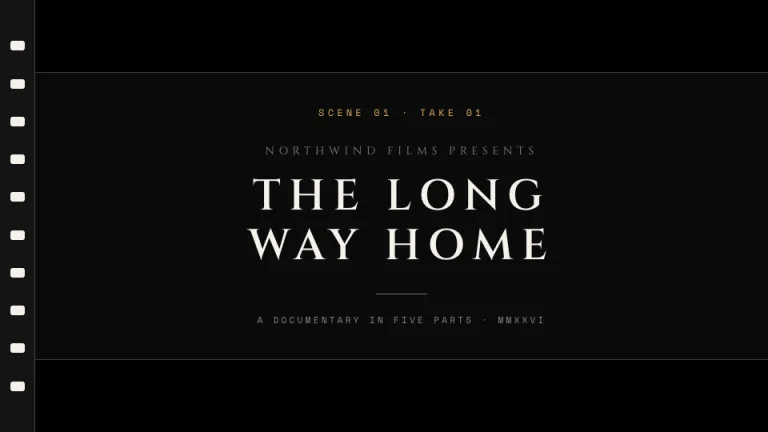
Cinema
現場安靜,開拍
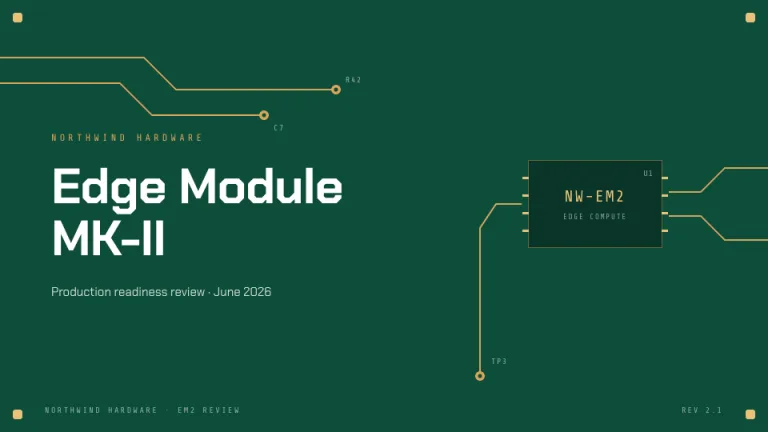
Circuit
順著鏈路走
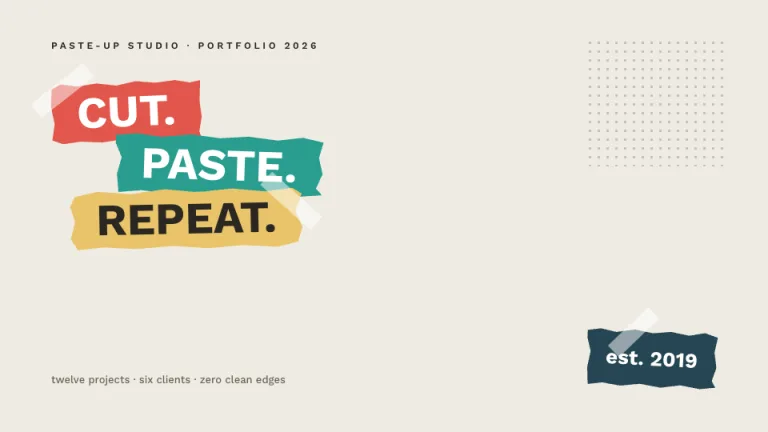
拼貼
先動剪刀,再談排版
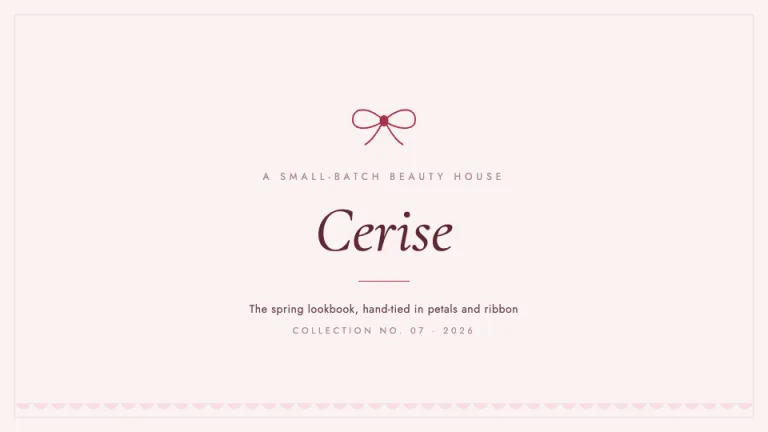
Coquette
緞帶、腮紅,和一抹櫻桃色
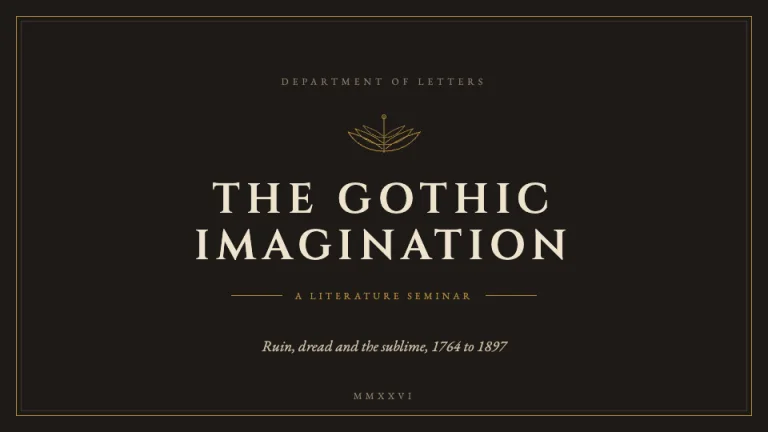
Dark Academia
燭光圖書館,古籍收藏會
Deloitte Style
黑與白,加一點綠
成果發表日
三分鐘,一頁一個想法
製圖室
量兩遍,講一次
遠征
此處標註議程
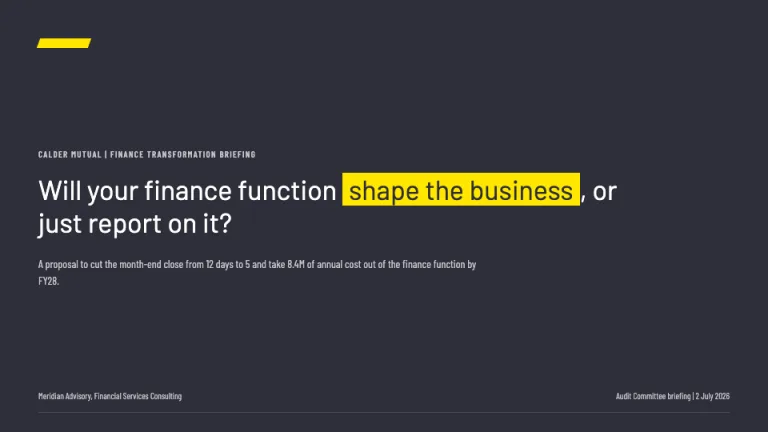
EY Style
深灰底色,一道果斷的黃光
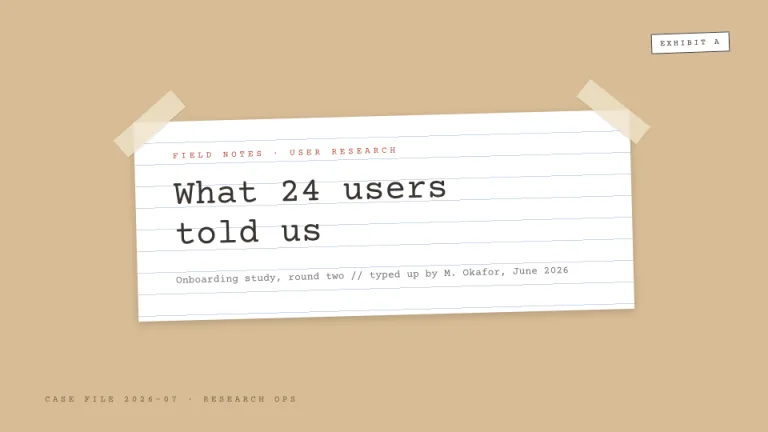
田野筆記
貼在資料夾上的那一頁
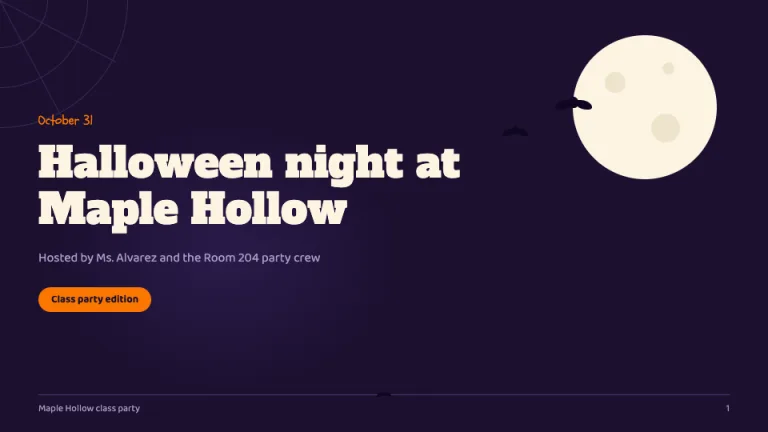
萬聖節
萬聖氛圍,課堂可用
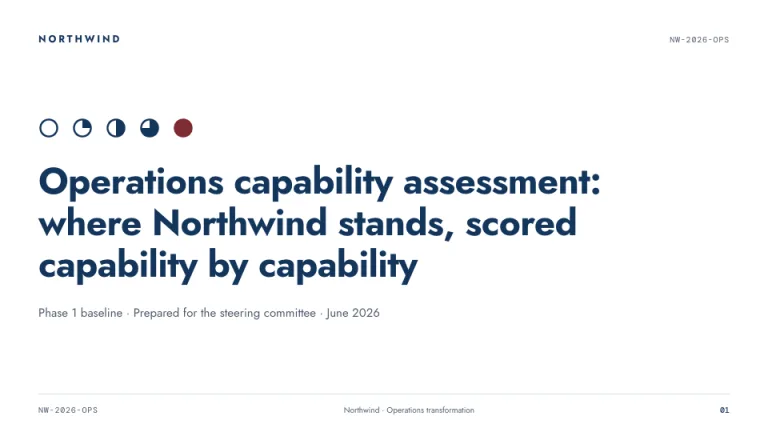
Harvey
按季推進的成熟度
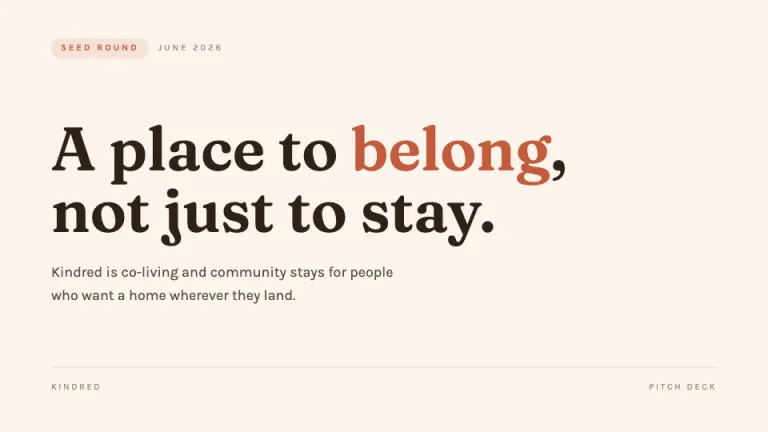
Hearth
溫暖的故事型品牌提案
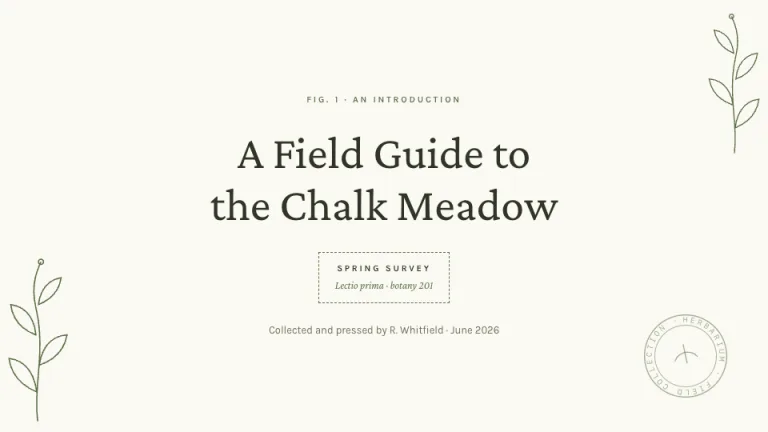
植物標本
壓製、標註、歸檔
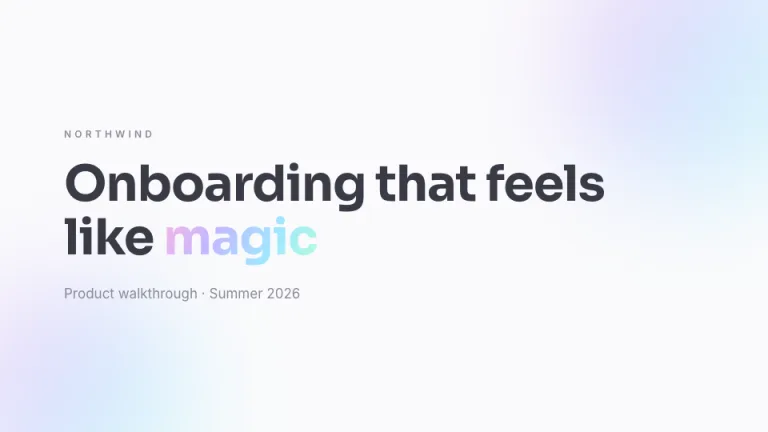
Holo
流光溢彩,但不失克制
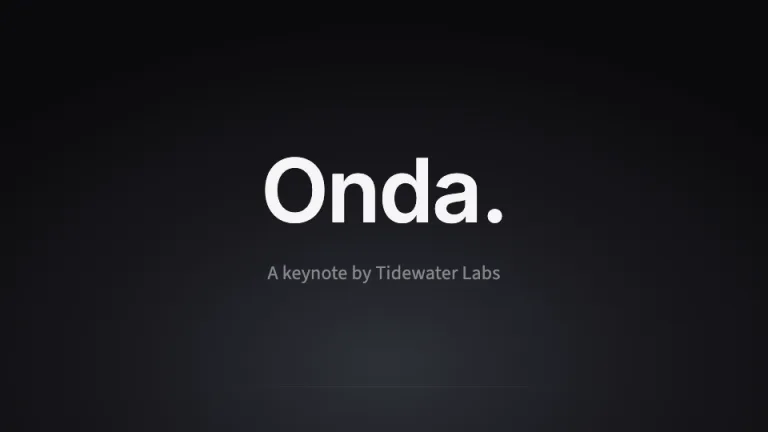
極簡主題演講
一頁一個觀點,絕不堆砌
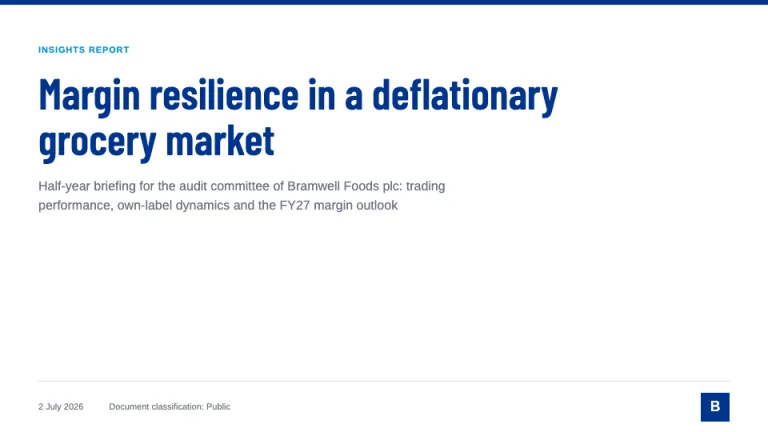
KPMG Style
審計級嚴謹,配 KPMG 藍
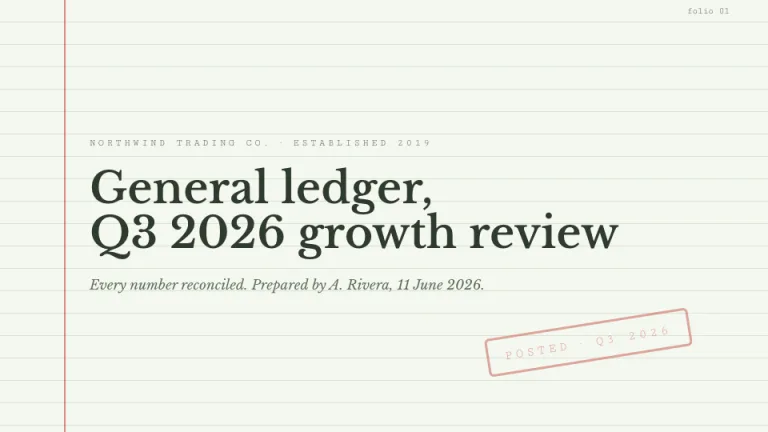
Ledger
每個數字都對得上帳
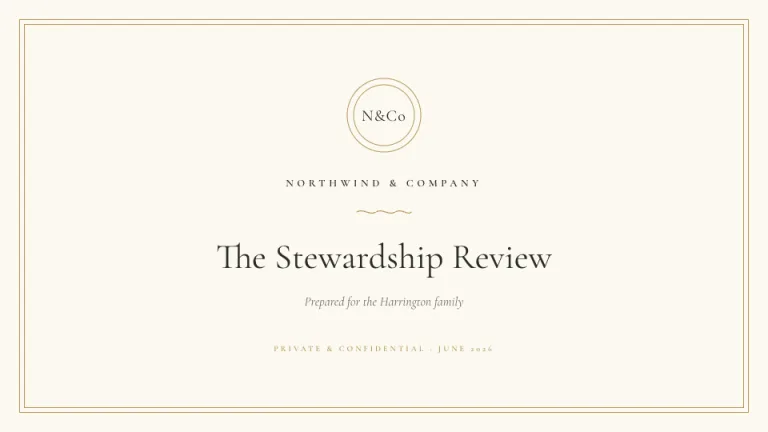
信箋
是刻上去的,不是印上去的
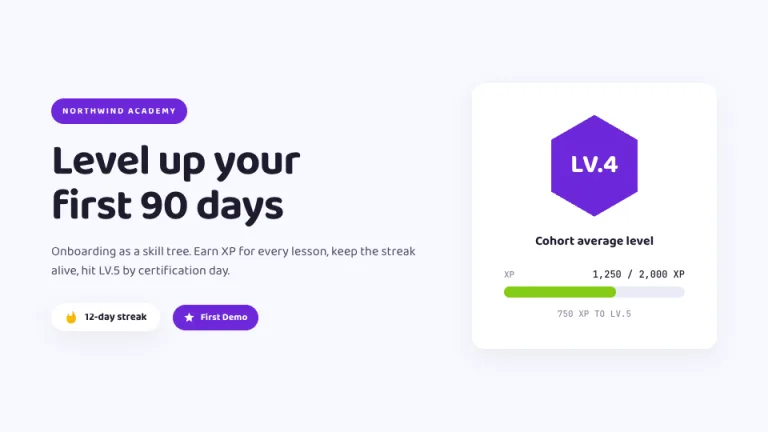
升級闖關
賺取經驗值
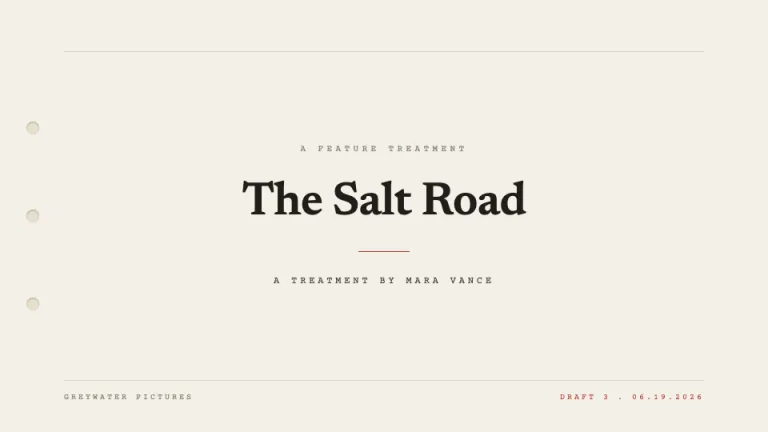
一句話簡介
一頁講完你的專案
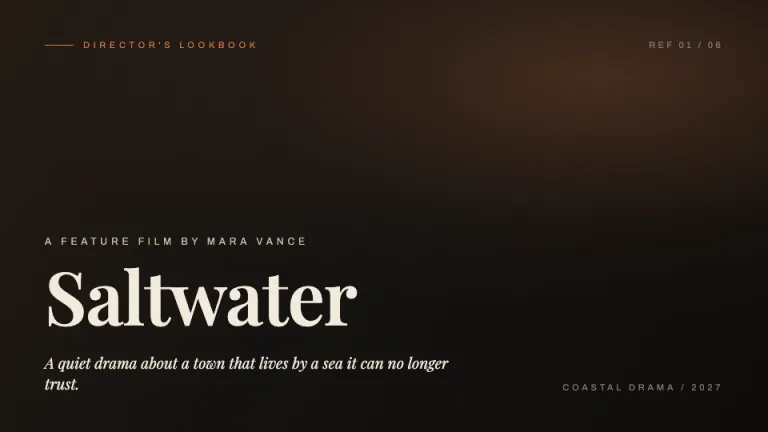
造型手冊
情緒、色調與構圖
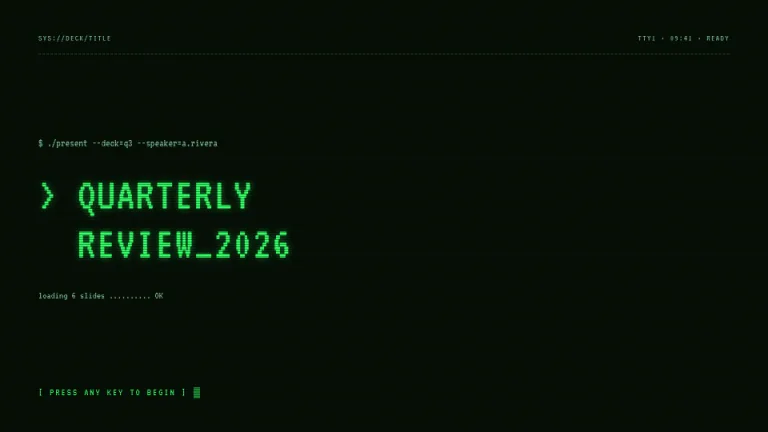
大型主機
直接來自機房
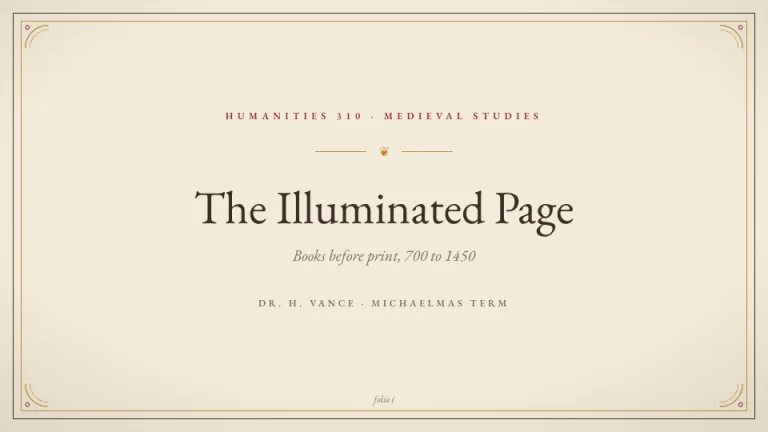
手稿
先做簡報,再談付印
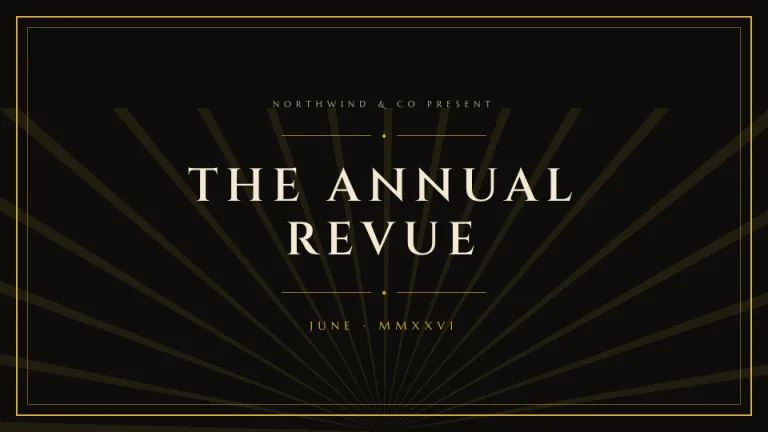
Marquee
把它辦成一件大事
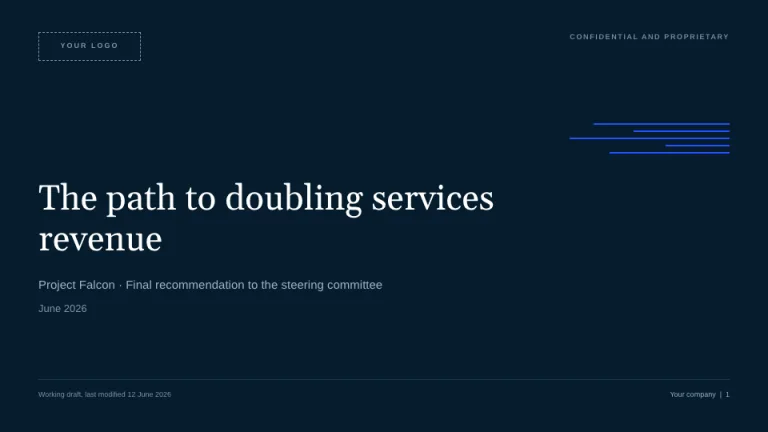
McKinsey Style
永遠先給結論
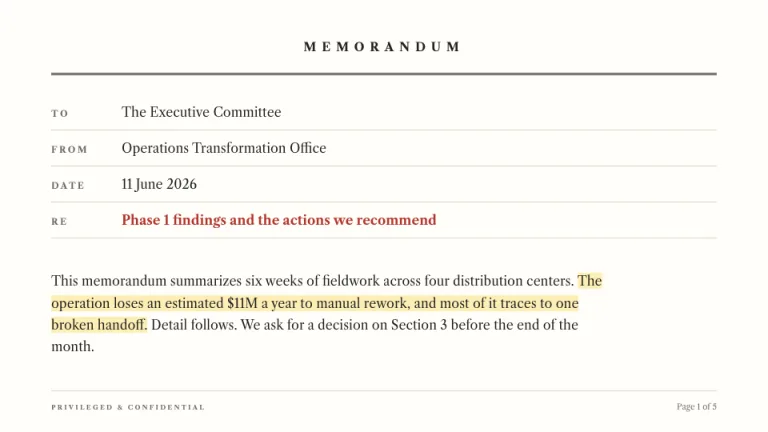
備忘錄
一如我上封備忘所述
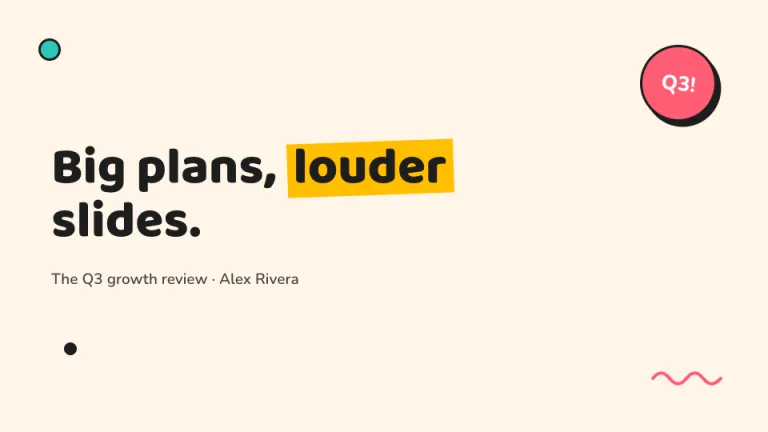
Memphis
正經內容,不正經畫風
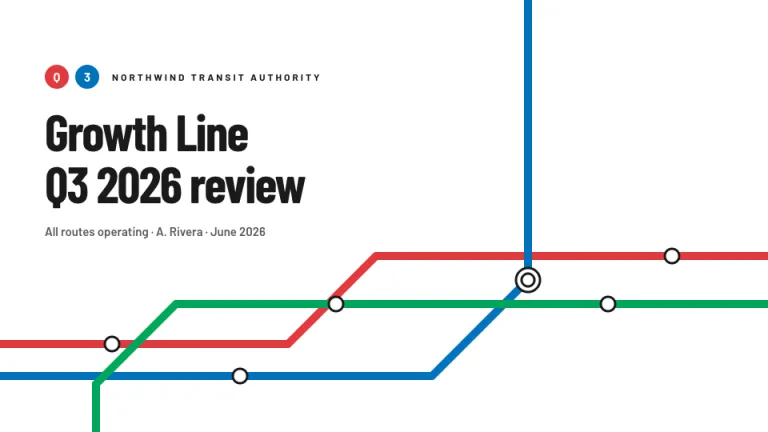
Metro
小心腳下的落差分析
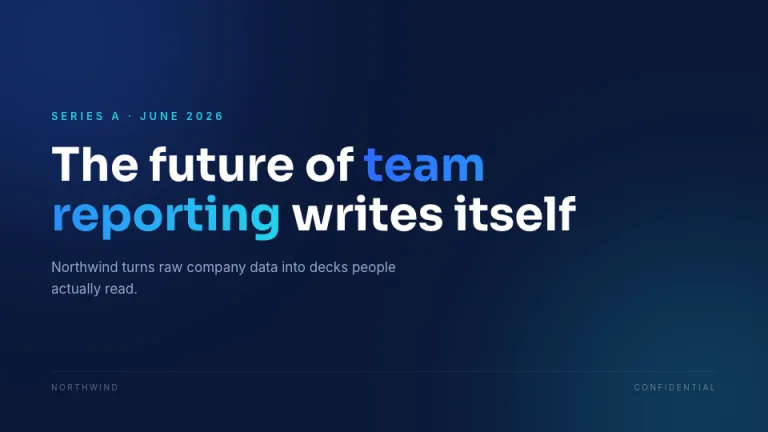
午夜路演
讓投資人身體前傾
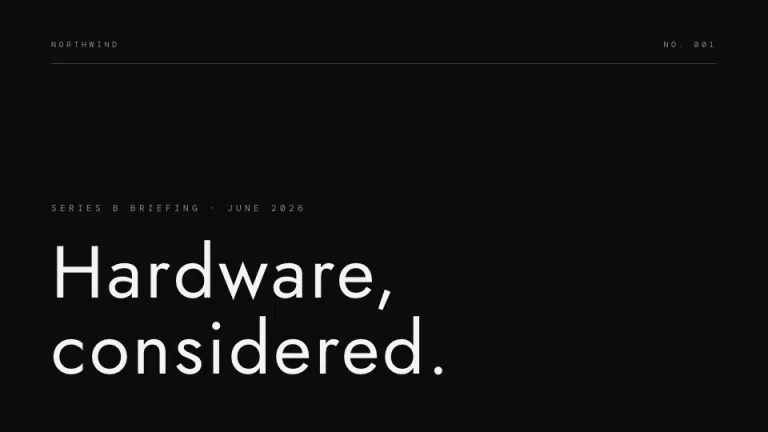
Monolith
昂貴的留白
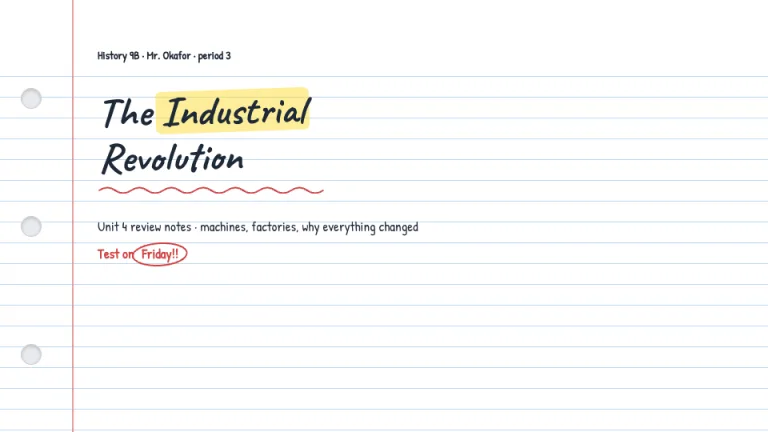
筆記本
連頁邊距一起給你
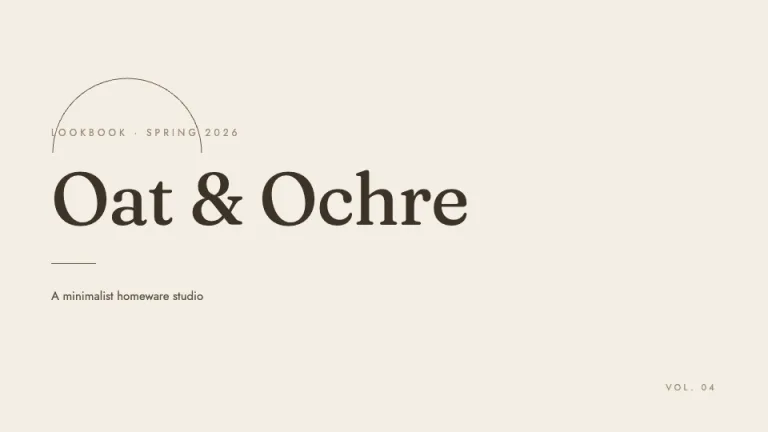
Oat
暖調中性色,靜謐拱廊,昂貴的平靜

天文台
把資料畫成星座
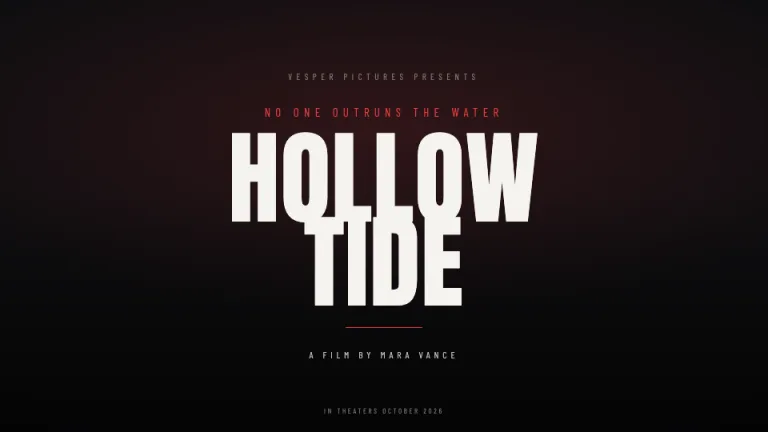
單頁海報
海報上最大的那個名字
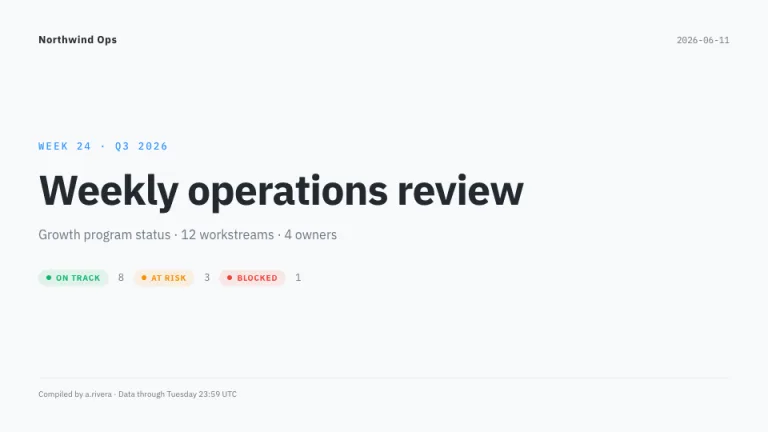
營運看板
只報狀態,不講故事
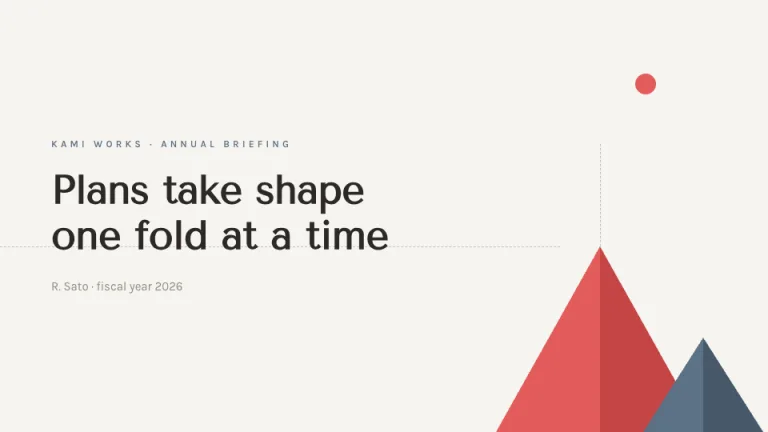
Origami
靠摺疊,不靠裝飾
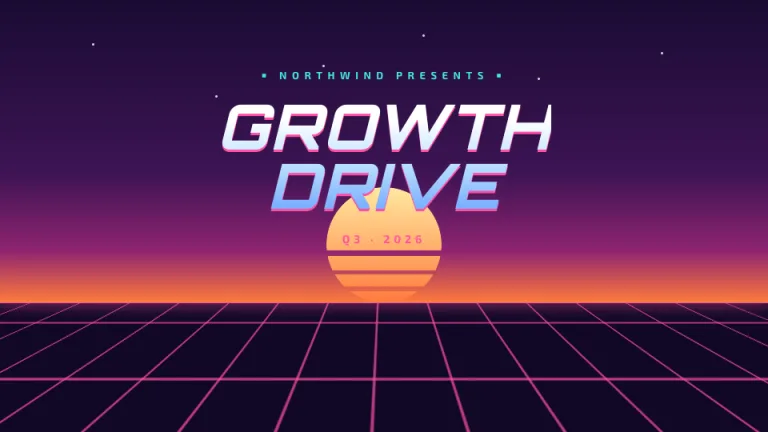
Outrun
原汁原味的 1986
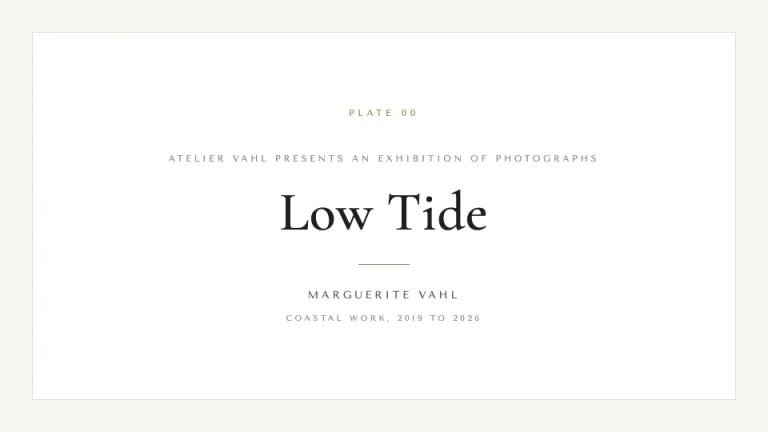
畫框襯紙
每一頁都是一間展廳
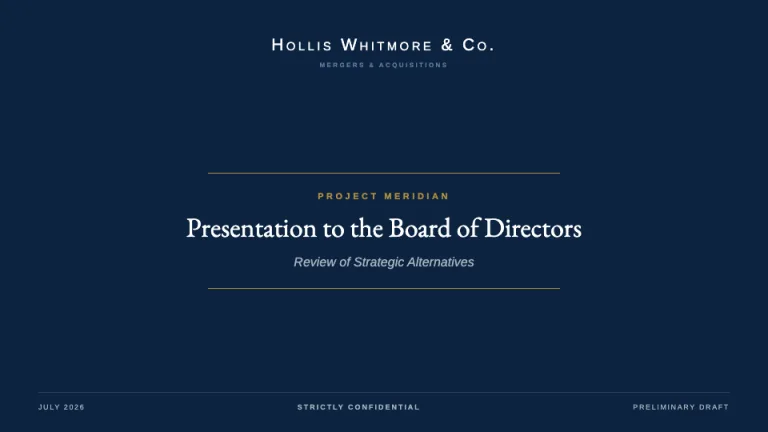
投行簡介冊
藏青的嚴謹,鎏金的分隔線,密不透風的說服力
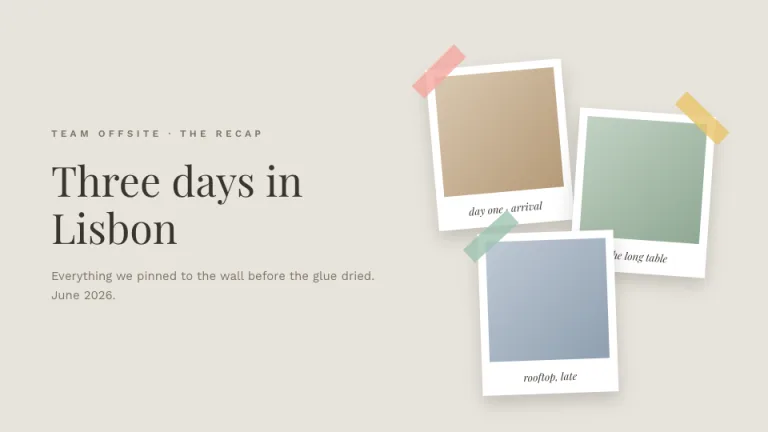
Polaroid
釘在牆上的那一版
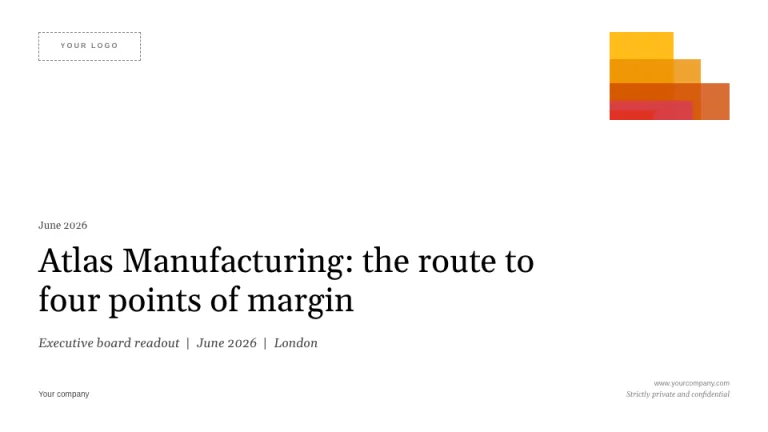
PwC Style
襯線標題,五種暖色
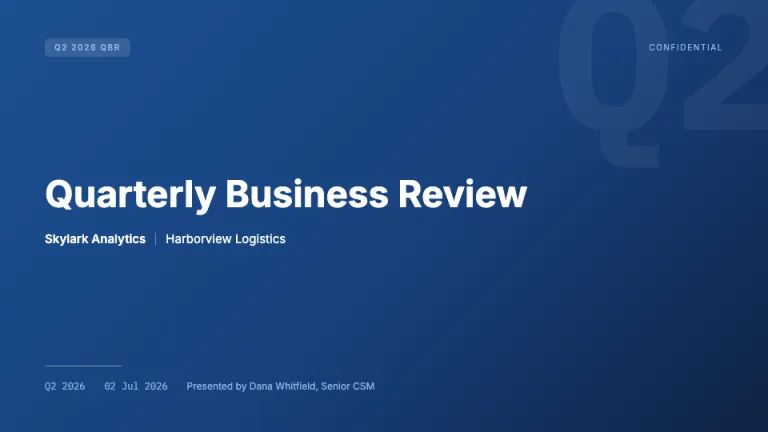
季度業務回顧
目標、實績,以及續約的故事
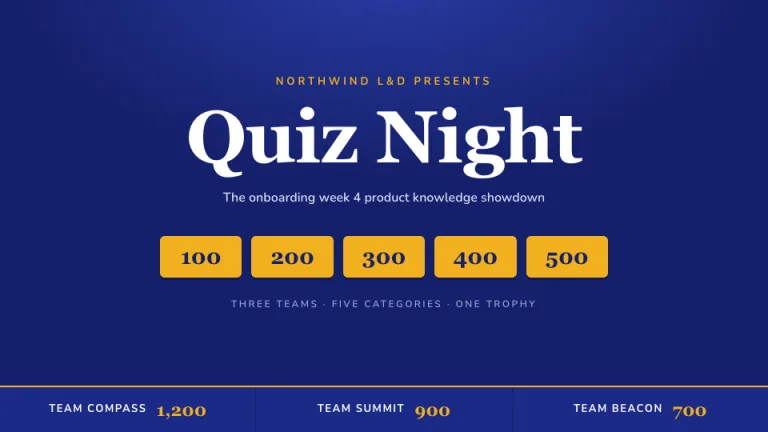
搶答之夜
帶搶答器的培訓
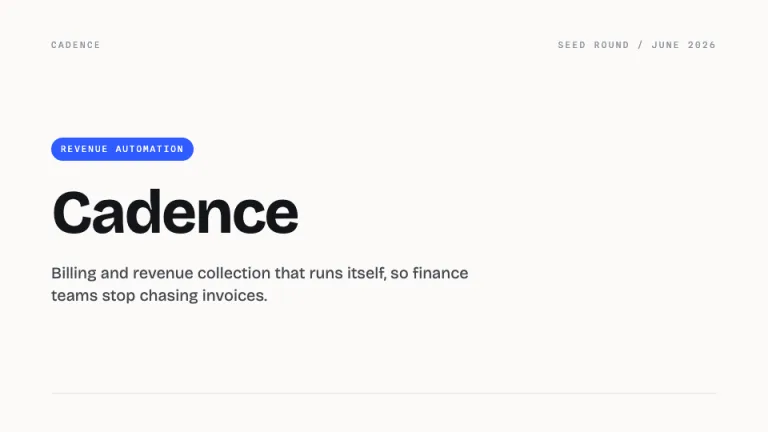
資金跑道
乾淨輕盈的投資路演
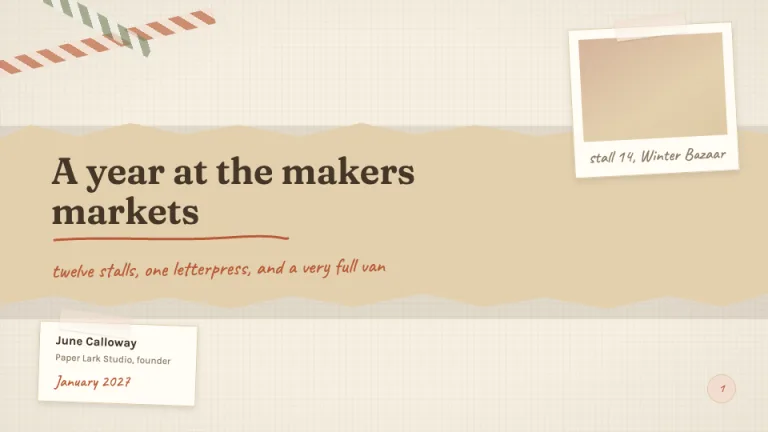
剪貼簿
紙張、膠帶,和手寫的味道
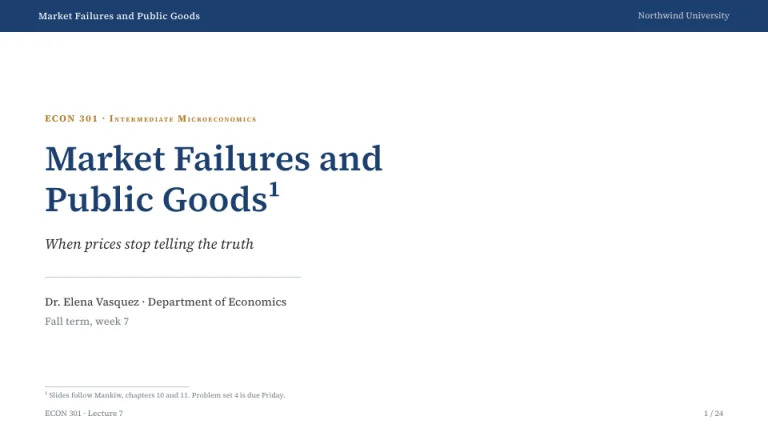
研討會
比 Beamer 好看的學術版型
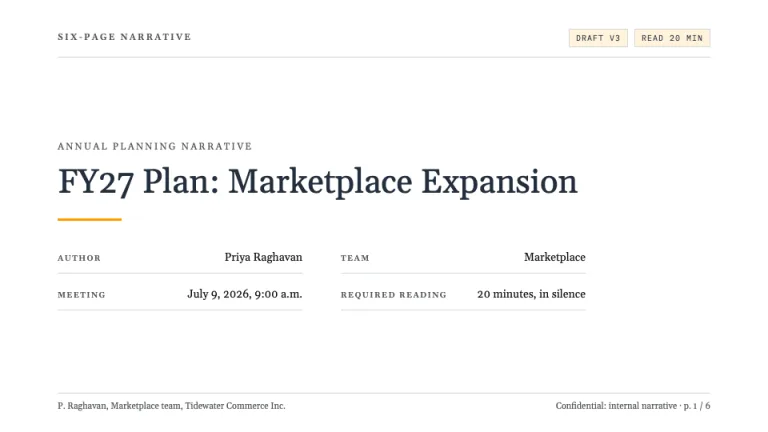
六頁備忘
一份主導整場會議的備忘錄
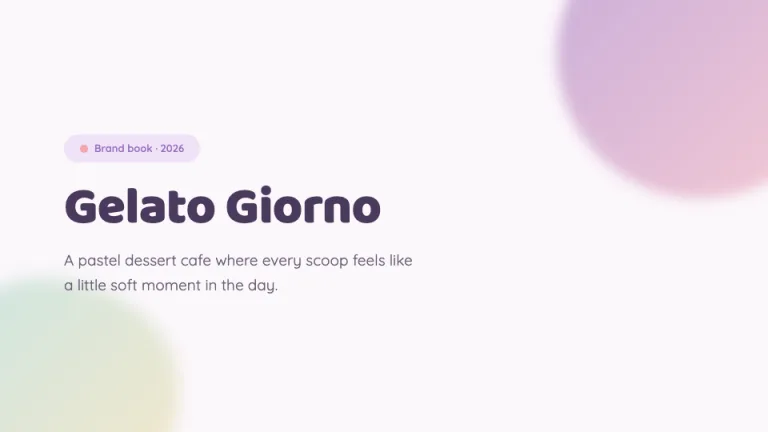
Sorbet
柔和粉彩,但不甜膩
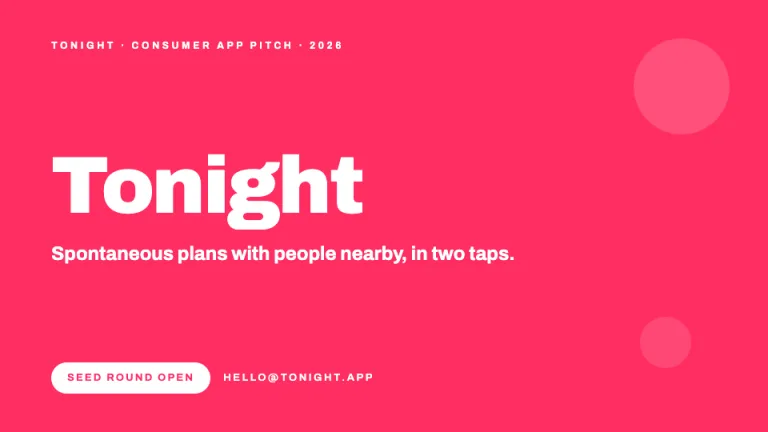
Spark
為消費級應用而生的高飽和粉
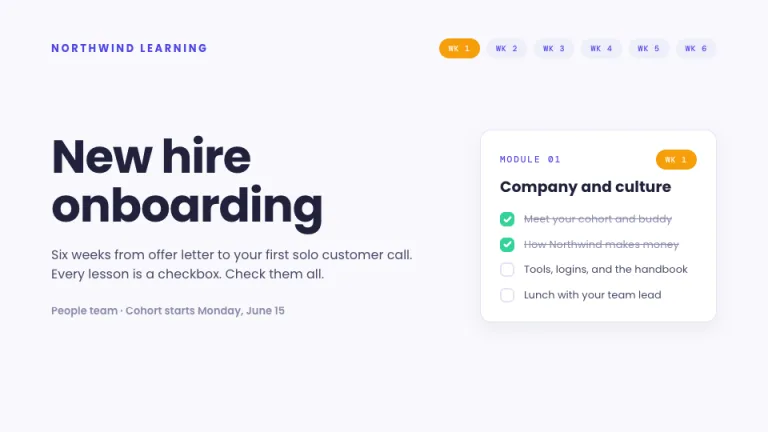
教學大綱
大綱本身就是設計
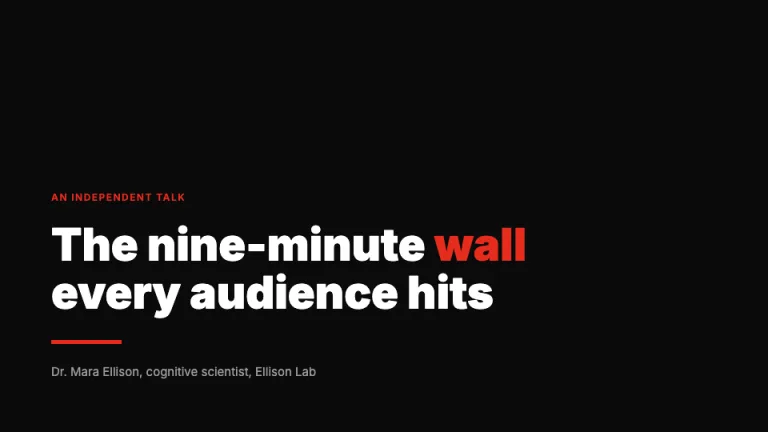
TED Style
字要夠大,底要夠黑
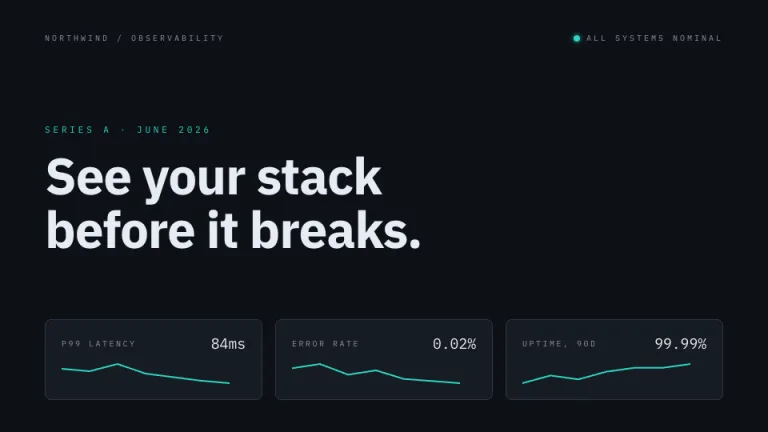
遙測面板
把簡報做成一塊儀表板
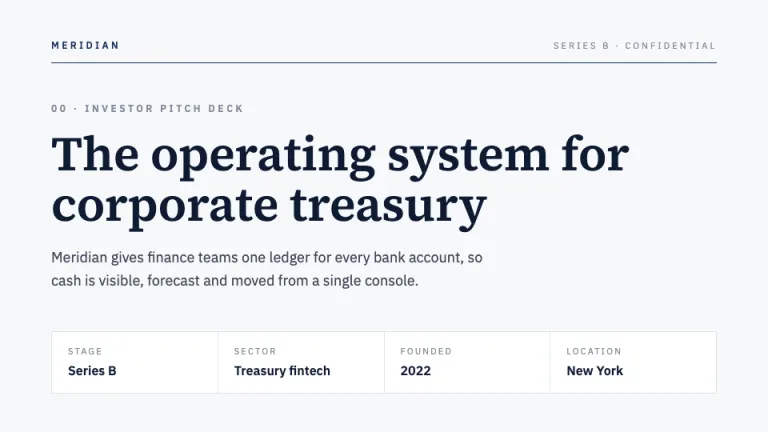
投資條件書
機構投資人慣用的條件框架
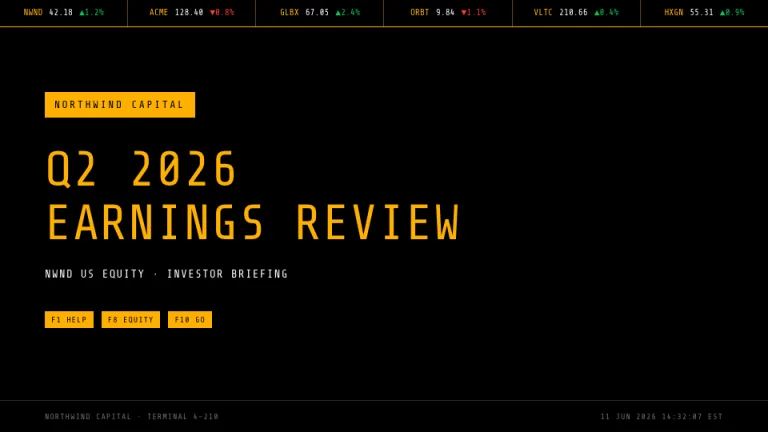
行情板
黑底琥珀光
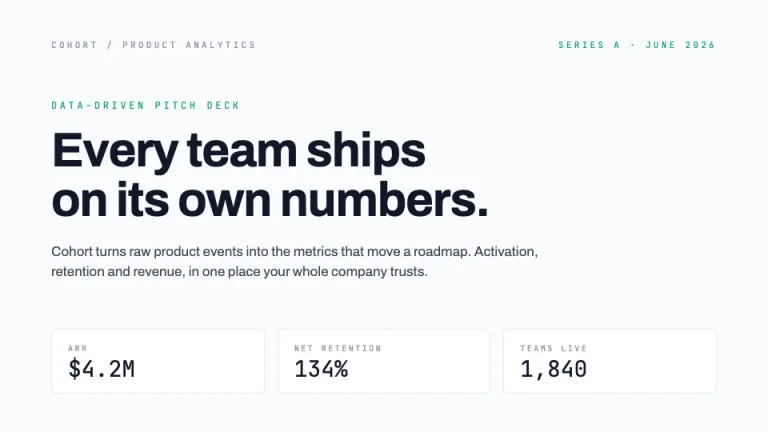
業務成長
讓數據自己說話
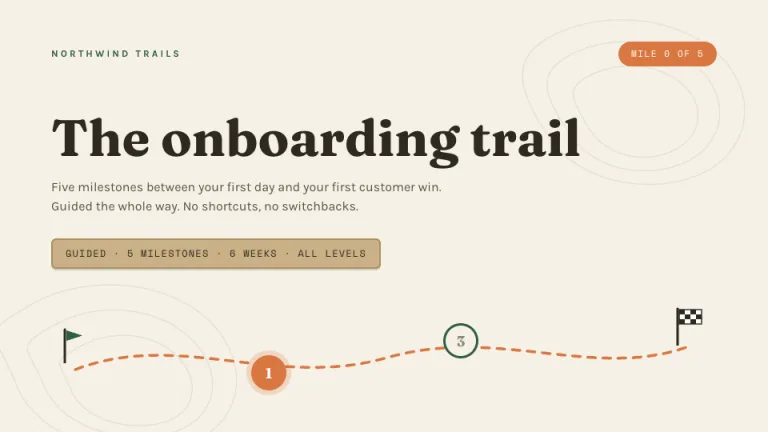
啟程
一次一英里地學下去
校隊
穿上隊服的顏色
白板
剛從工作坊裡端出來
野花
手採而來,隨意插放
線框圖
視覺稿之前就先上線
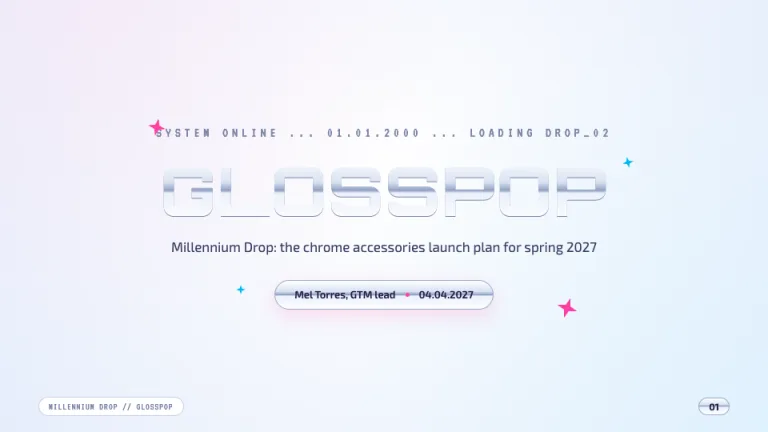
Y2K
來自 2000 年的鍍鉻幻夢
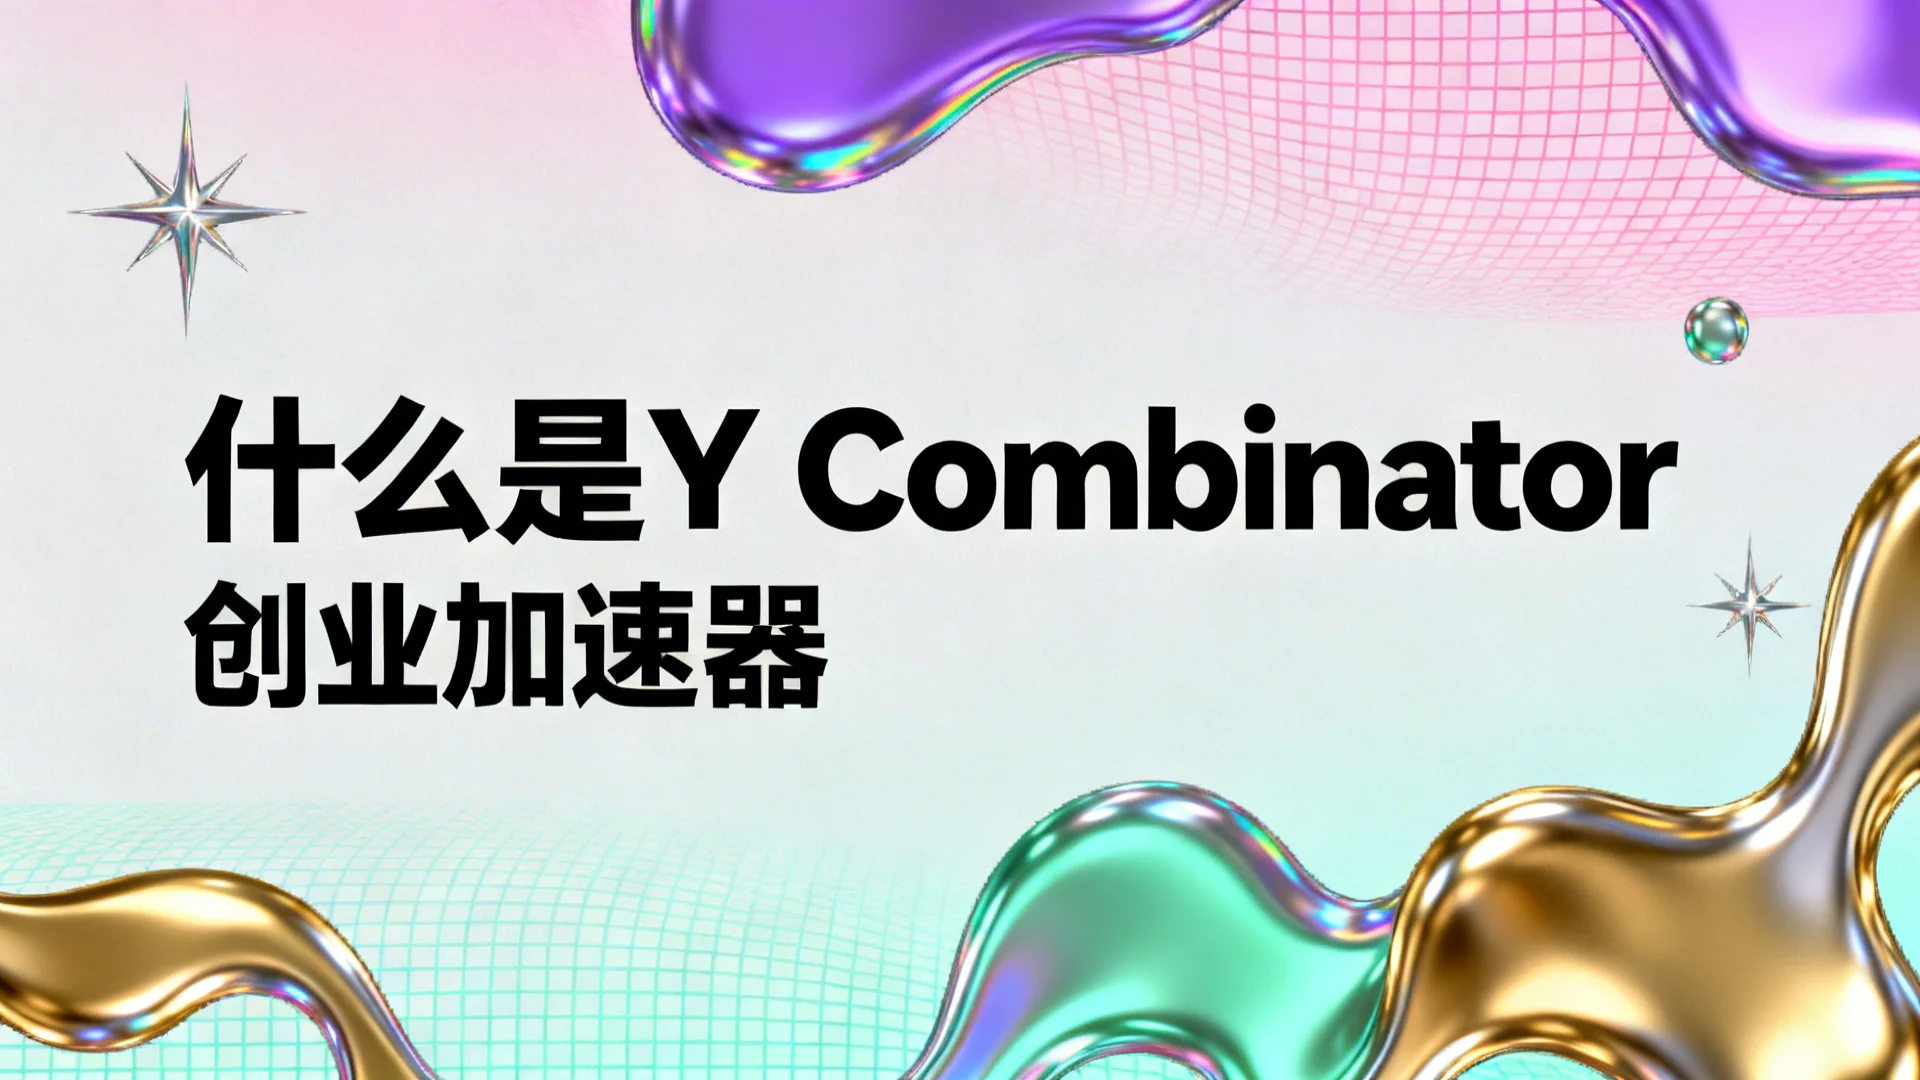
Acid Graphics Y2K (酸性设计)
Acid graphics Y2K style PPT slide, Light gray background, title text, subtitle below, key stats in stylized cards, Metallic chrome elements, holographic accents, Colors: purple #B185FF, pink #FF6EC7, mint #7BFFCB, gold #FFD700, Liquid shapes, star sparkles, mesh gradients, Y2K aesthetic, futuristic design, 16:9
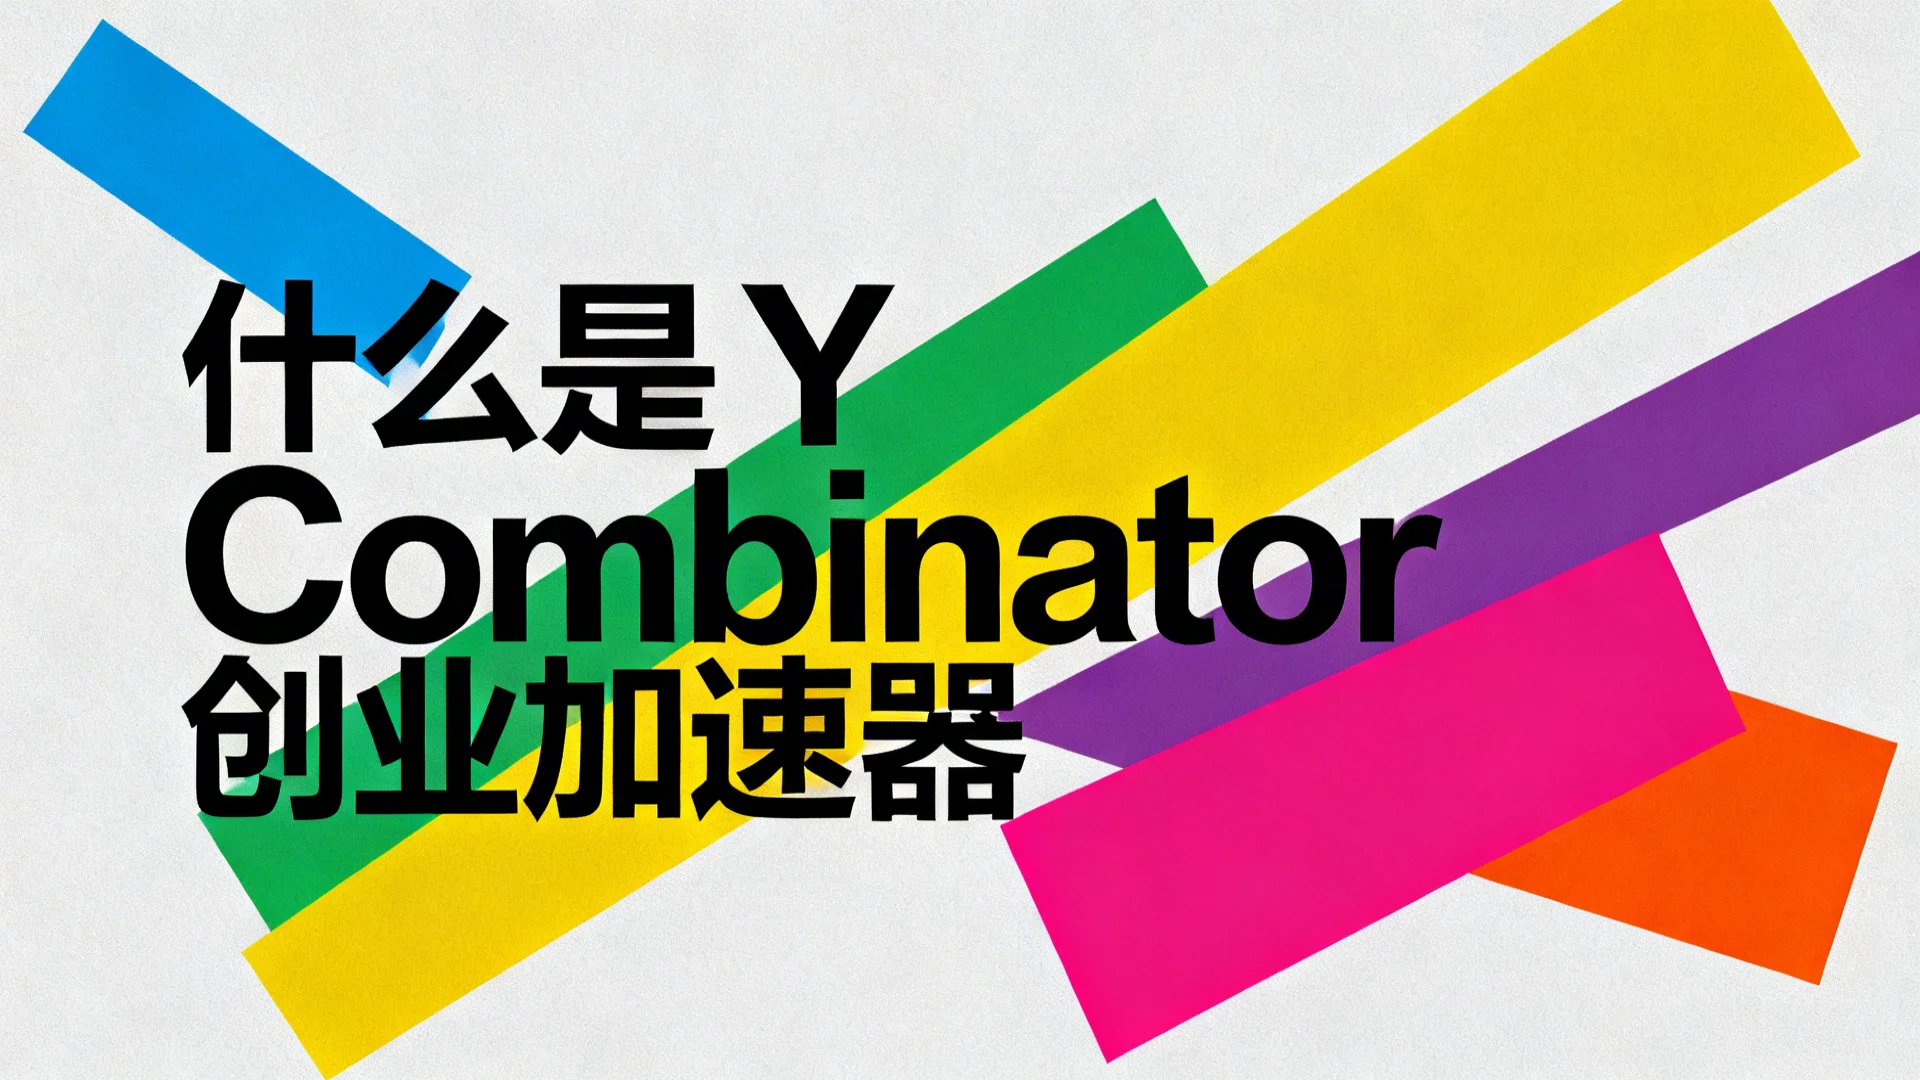
Swiss International (瑞士国际主义)
Swiss international style PPT slide, brutalist graphic design, Light gray background, bold title text, subtitle with diagonal layout, key stats in geometric blocks, High saturation colors: blue #007AFF, green #00994D, yellow #FFF066, purple #9966FF, pink #FF3399, orange #FF8800, Helvetica font, Asymmetric composition, 16:9
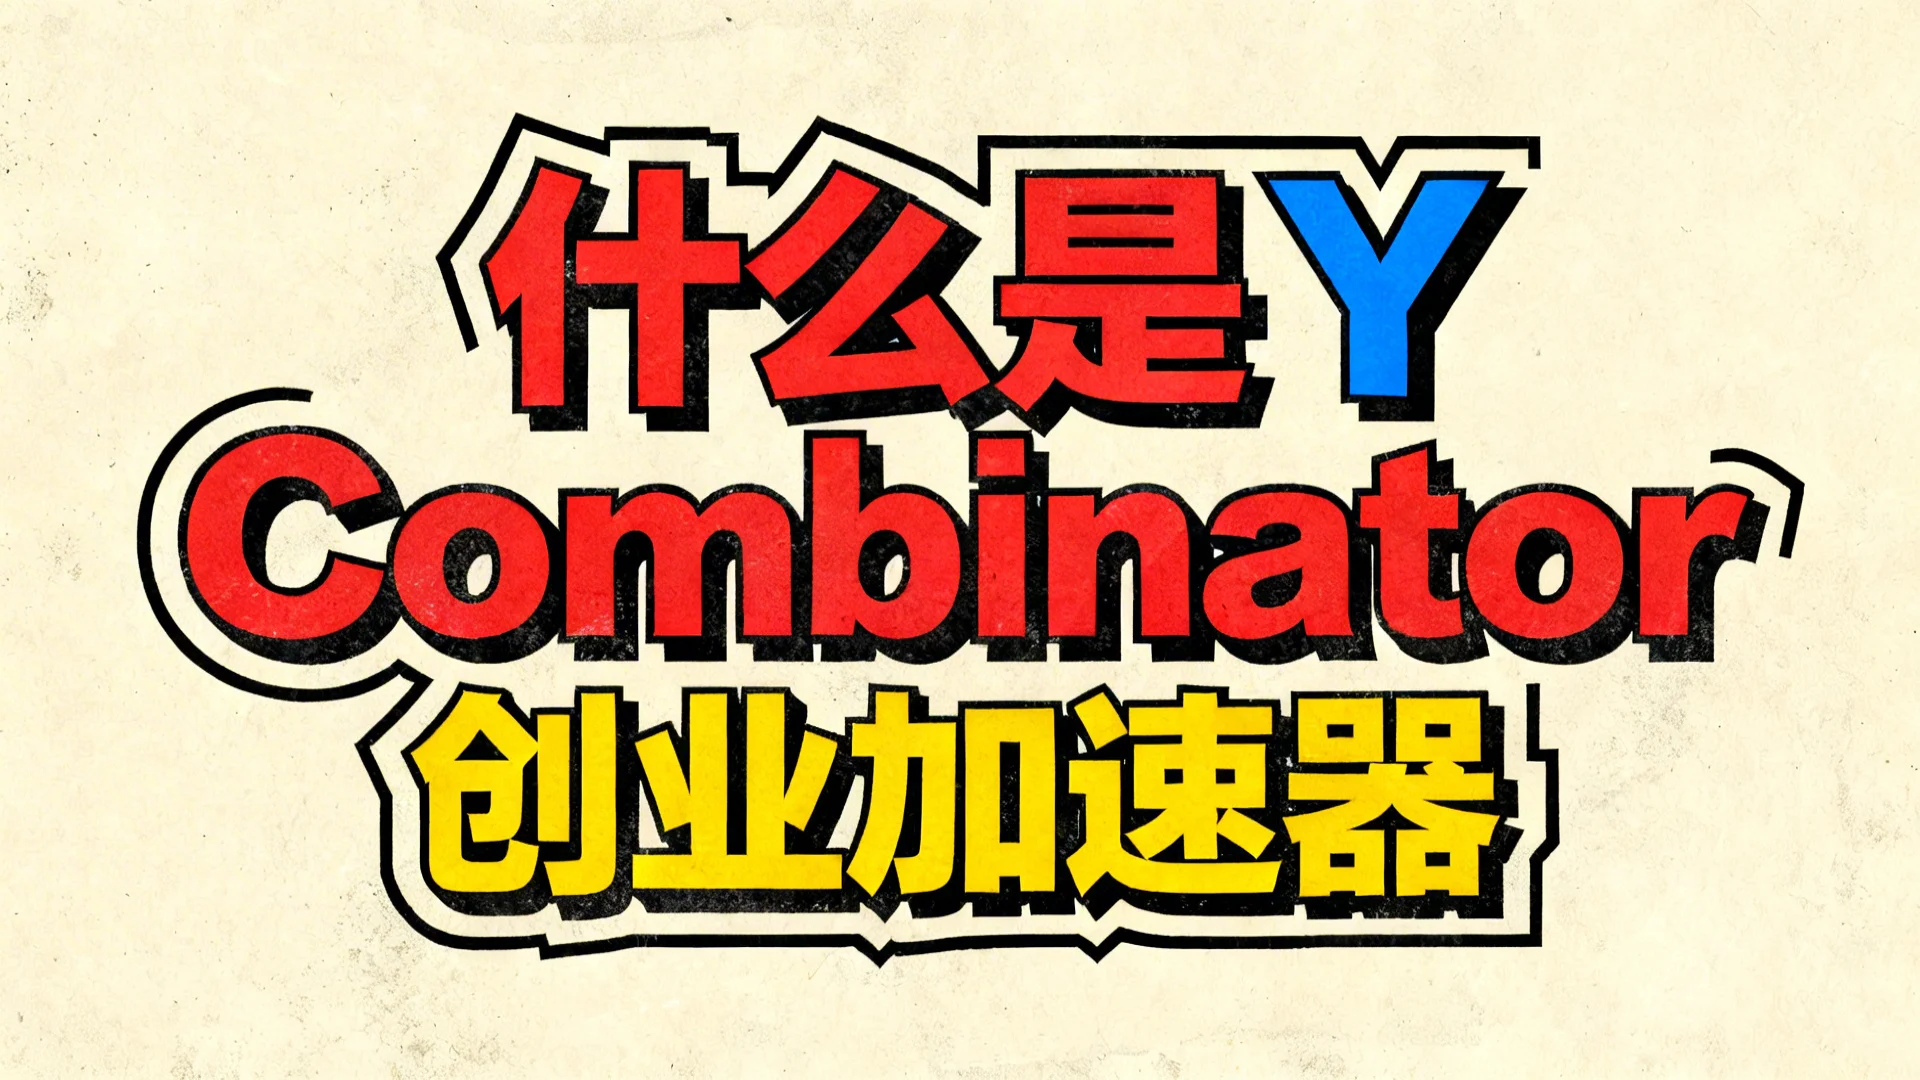
Neo-Brutalism (新粗野主义)
Neo-brutalism style PPT slide, raw design, Cream background, bold title text, subtitle below, key stats displayed, Bold primary colors: red #FF4D4D, blue #4D94FF, yellow #FFD93D, Thick 4px black outlines, hard shadows, Brutalist frames, bold typography, Stark contrast, 16:9
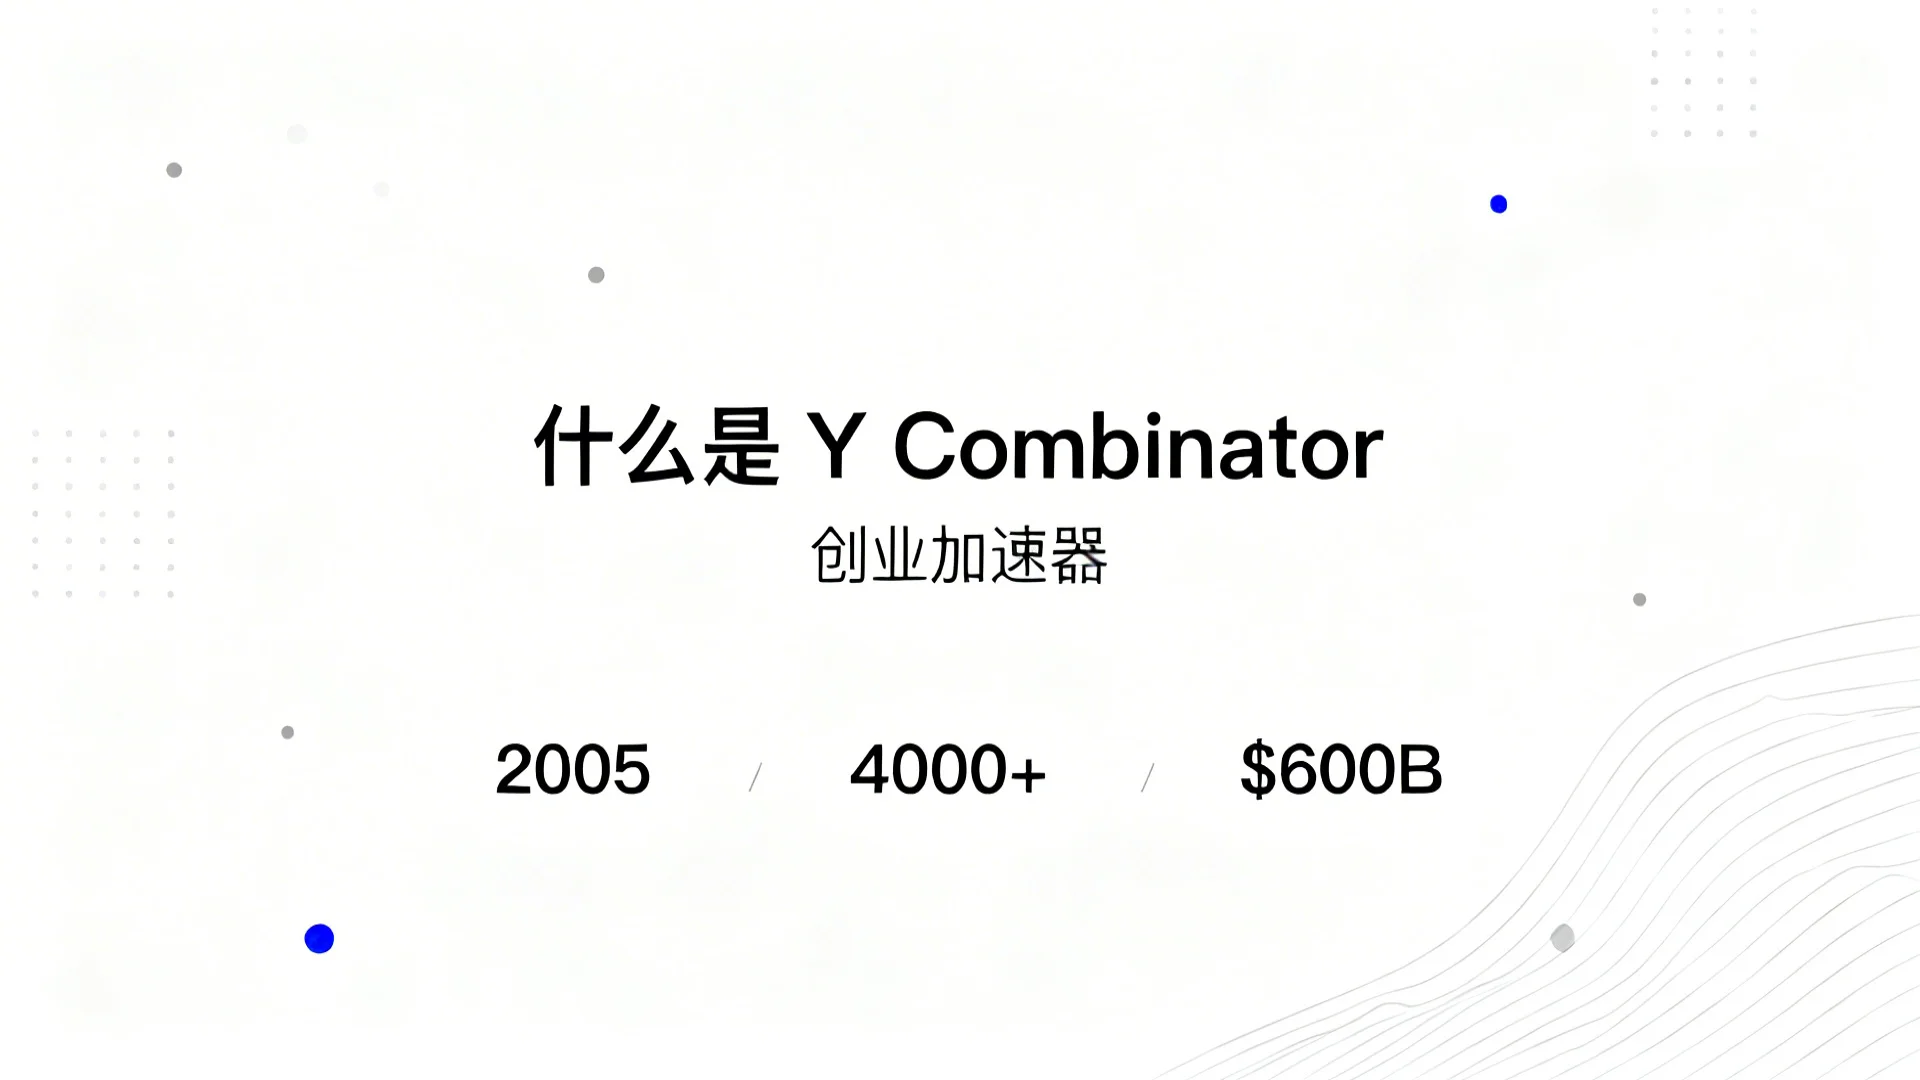
Minimalist Clean (极简主义)
Minimalist clean design PPT slide, White background, generous whitespace, centered title text, subtitle below, key stats in simple cards, Subtle gray and blue accents, Thin elegant lines, Inter Helvetica font, Professional corporate presentation, Simple elegant layout, 16:9
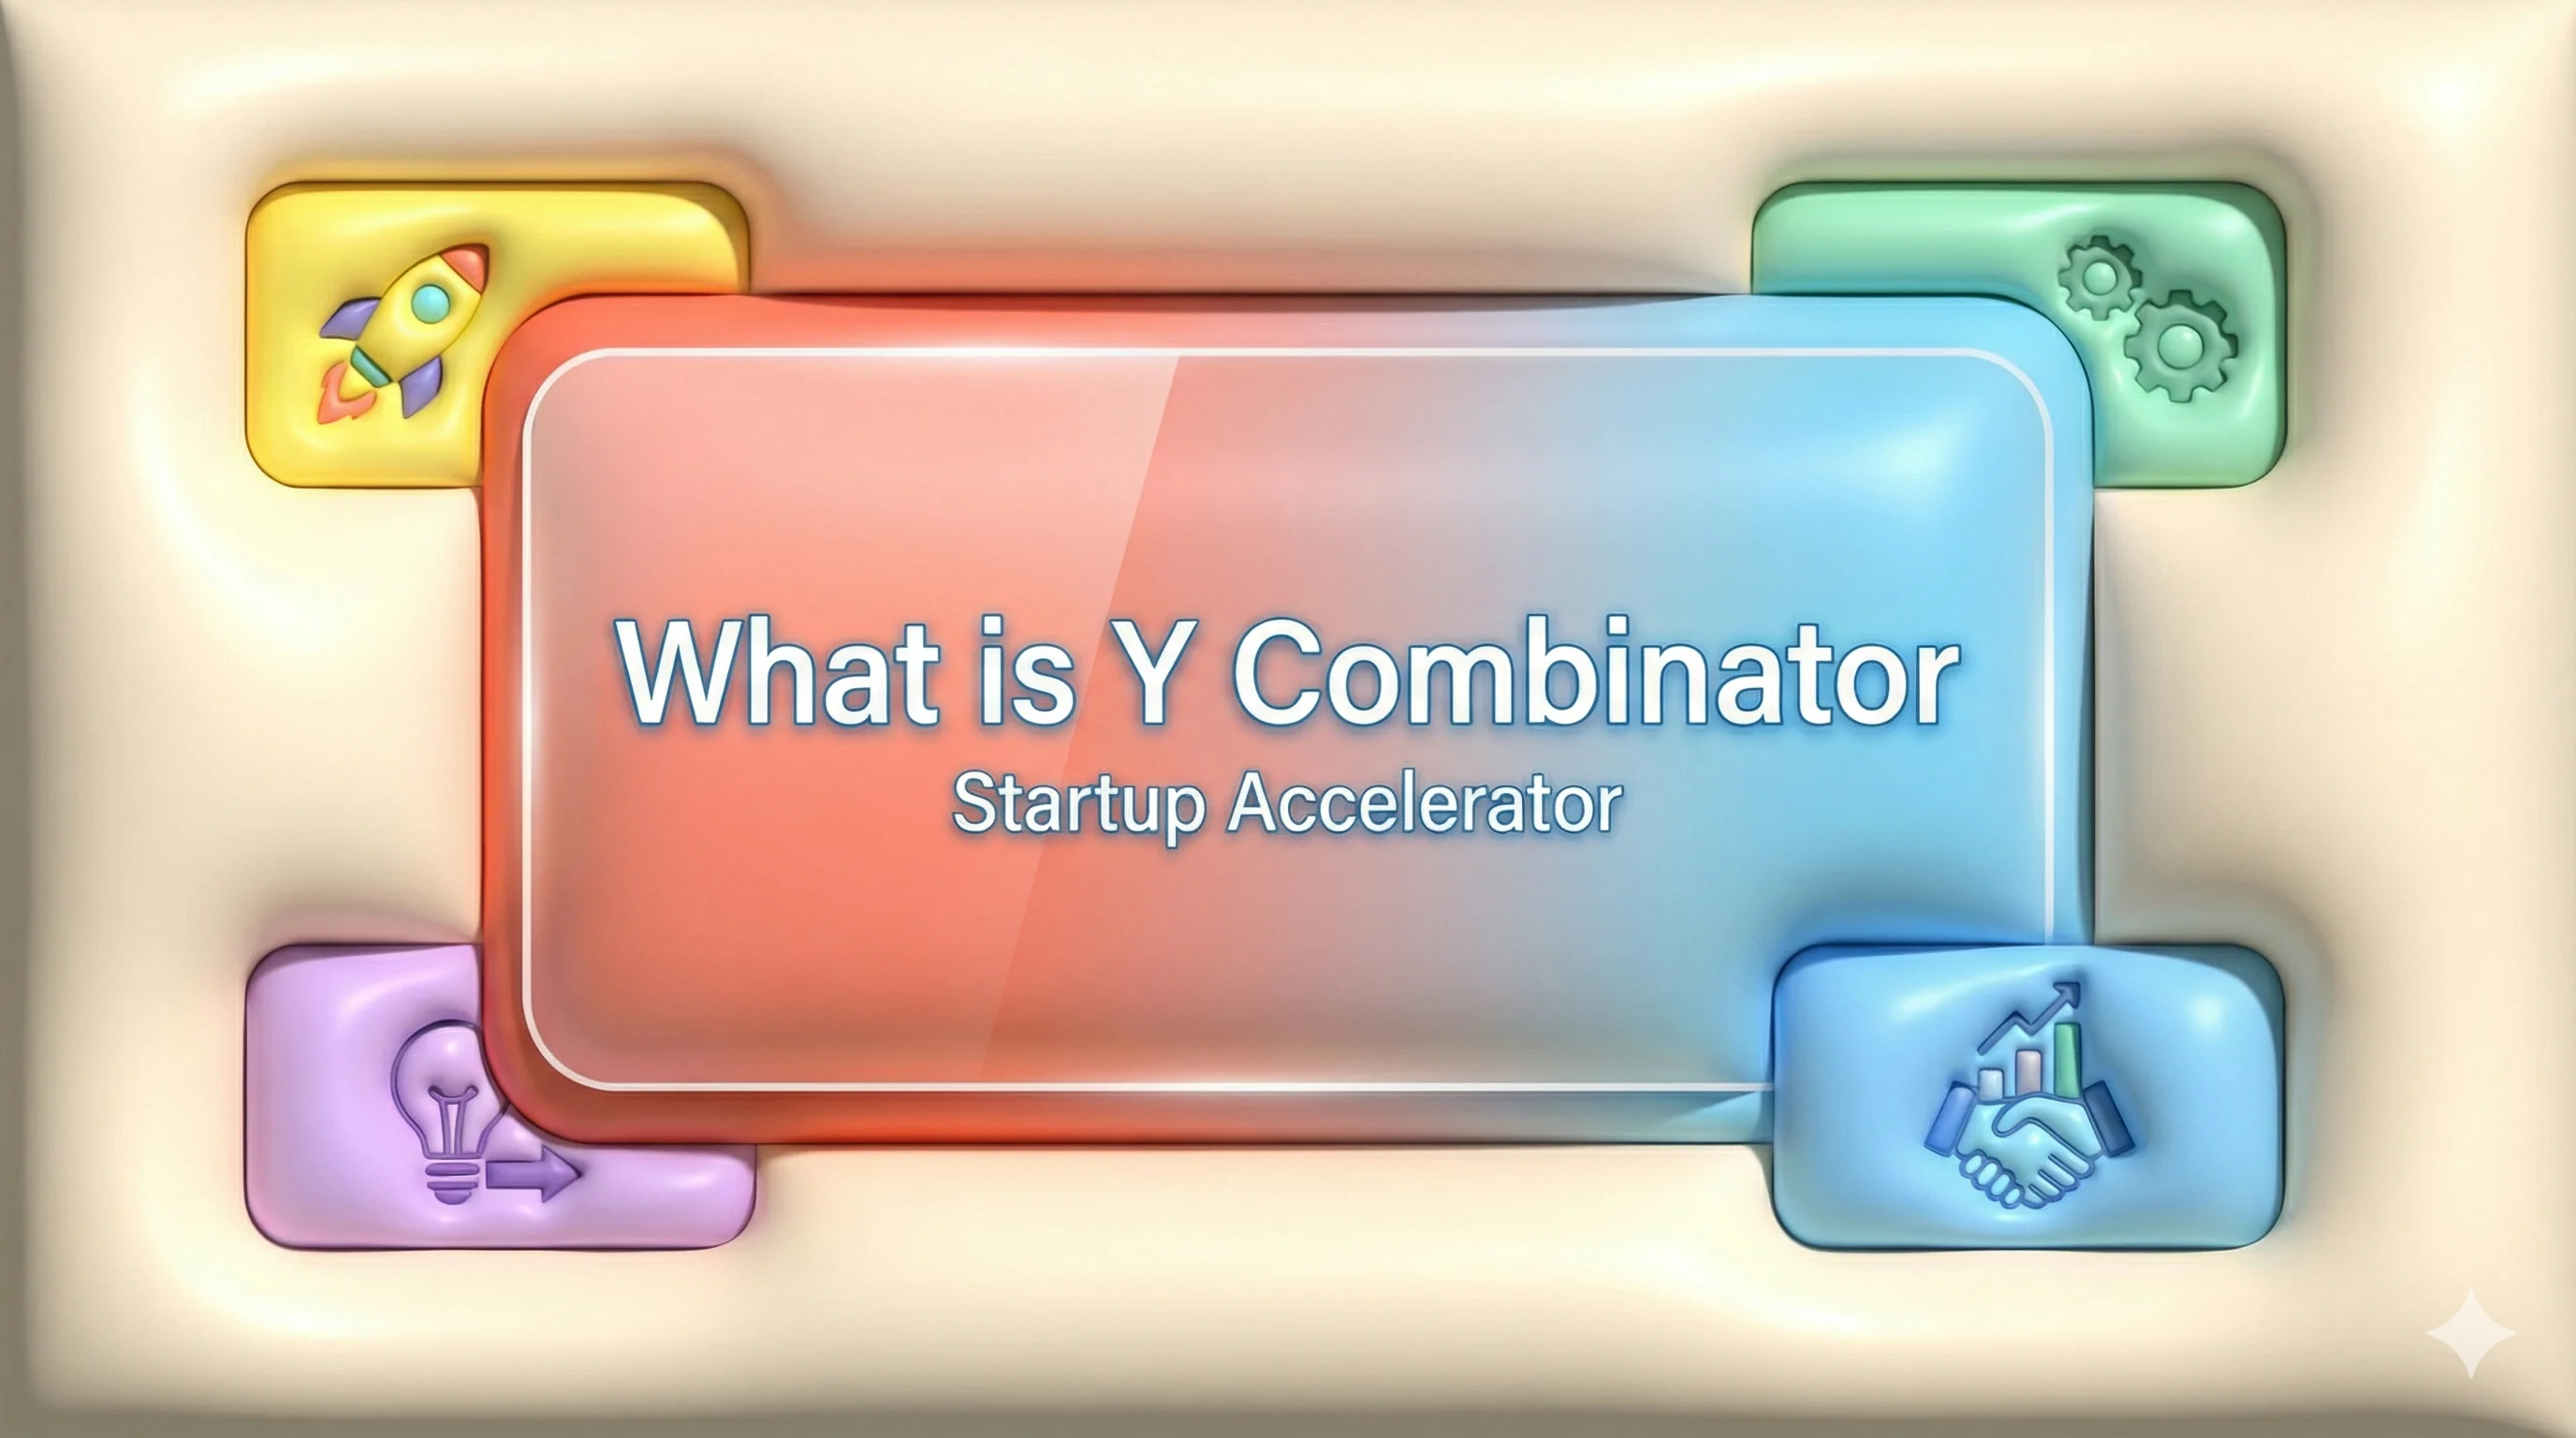
Claymorphism (黏土拟态)
Claymorphism style PPT slide, soft chunky 3D clay interface, thick toy-like rounded cards, inflated pill buttons, tactile depth with bright top-left inner highlights and soft bottom-right shadows, creamy warm background, bold title text, subtitle below, 3 to 5 key statistics in colorful chunky cards, candy palette with coral #FF7A59, sky blue #6EC5FF, lemon yellow #FFD85E, mint #7EE2B8, lavender #B79CFF, bubbly icons, smooth plastic texture, friendly high-contrast presentation design, clean single-slide composition, 16:9
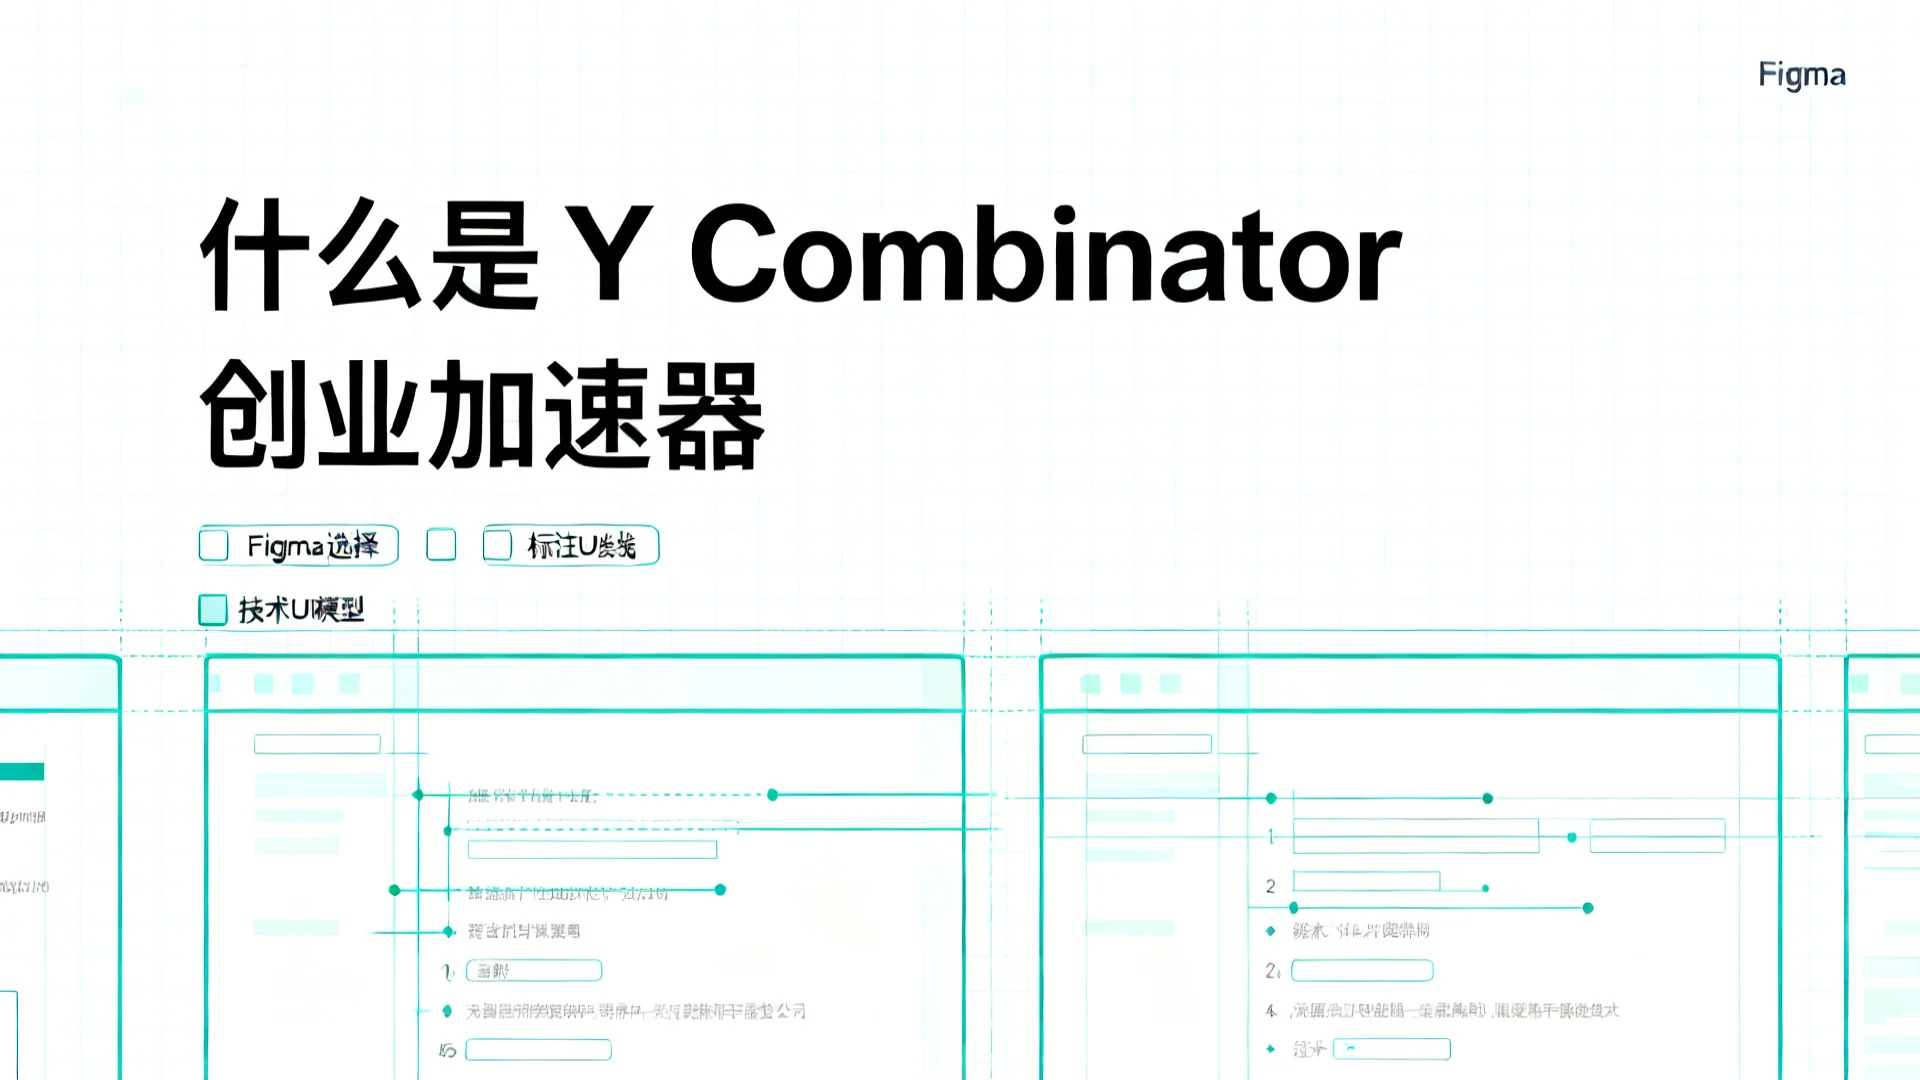
Design Blueprint (设计蓝图)
Design blueprint PPT slide, Figma documentation style, White background with cyan grid lines #66B8CC, title text, subtitle below, Figma selection boxes with control points, Annotation lines, numbered labels, Technical UI mockup aesthetic, Clean sans-serif Inter font, 16:9
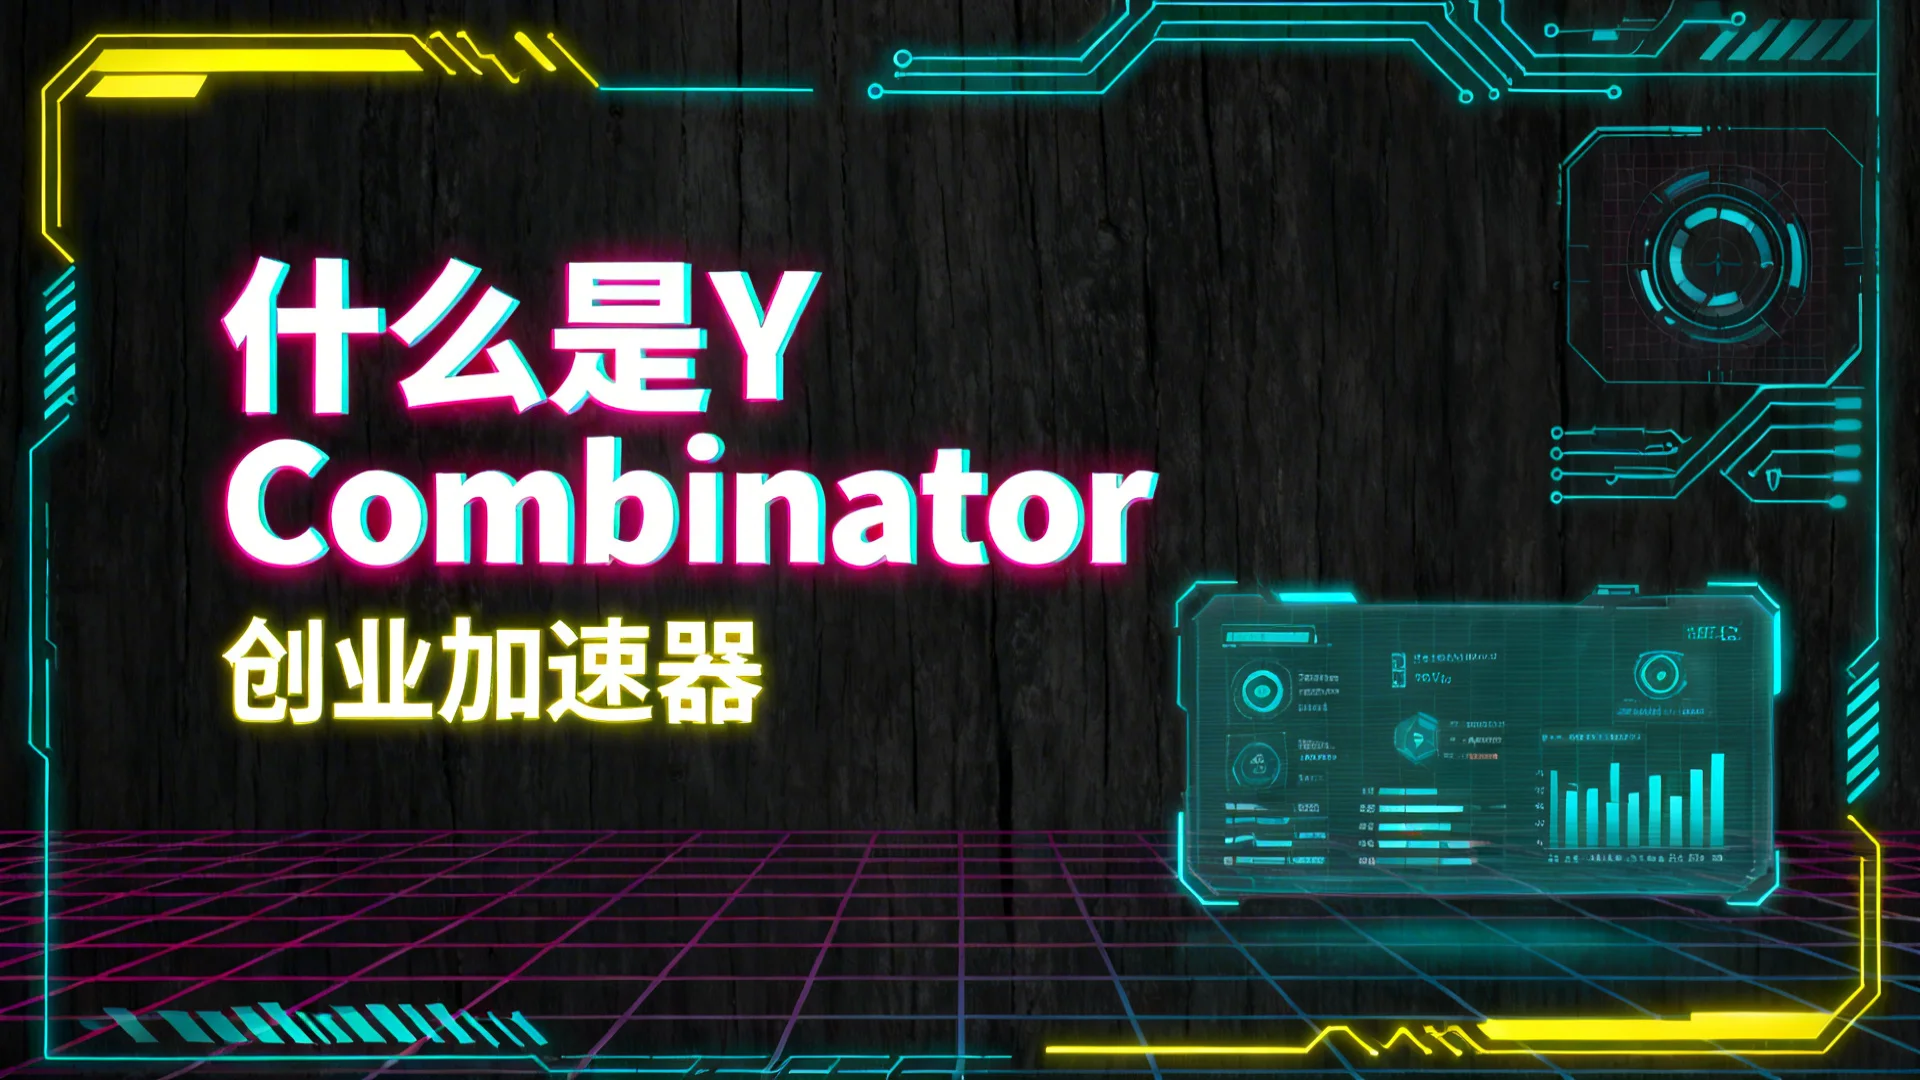
Cyberpunk Neon (赛博朋克)
Cyberpunk neon style PPT slide, Dark charcoal background, title text with neon glow effect, subtitle below, Neon colors: magenta #FF00FF, cyan #00FFFF, yellow #FFFF00, Tech grid patterns, circuit decorations, Holographic data panels, glow effects, Futuristic UI elements, Digital presentation, 16:9
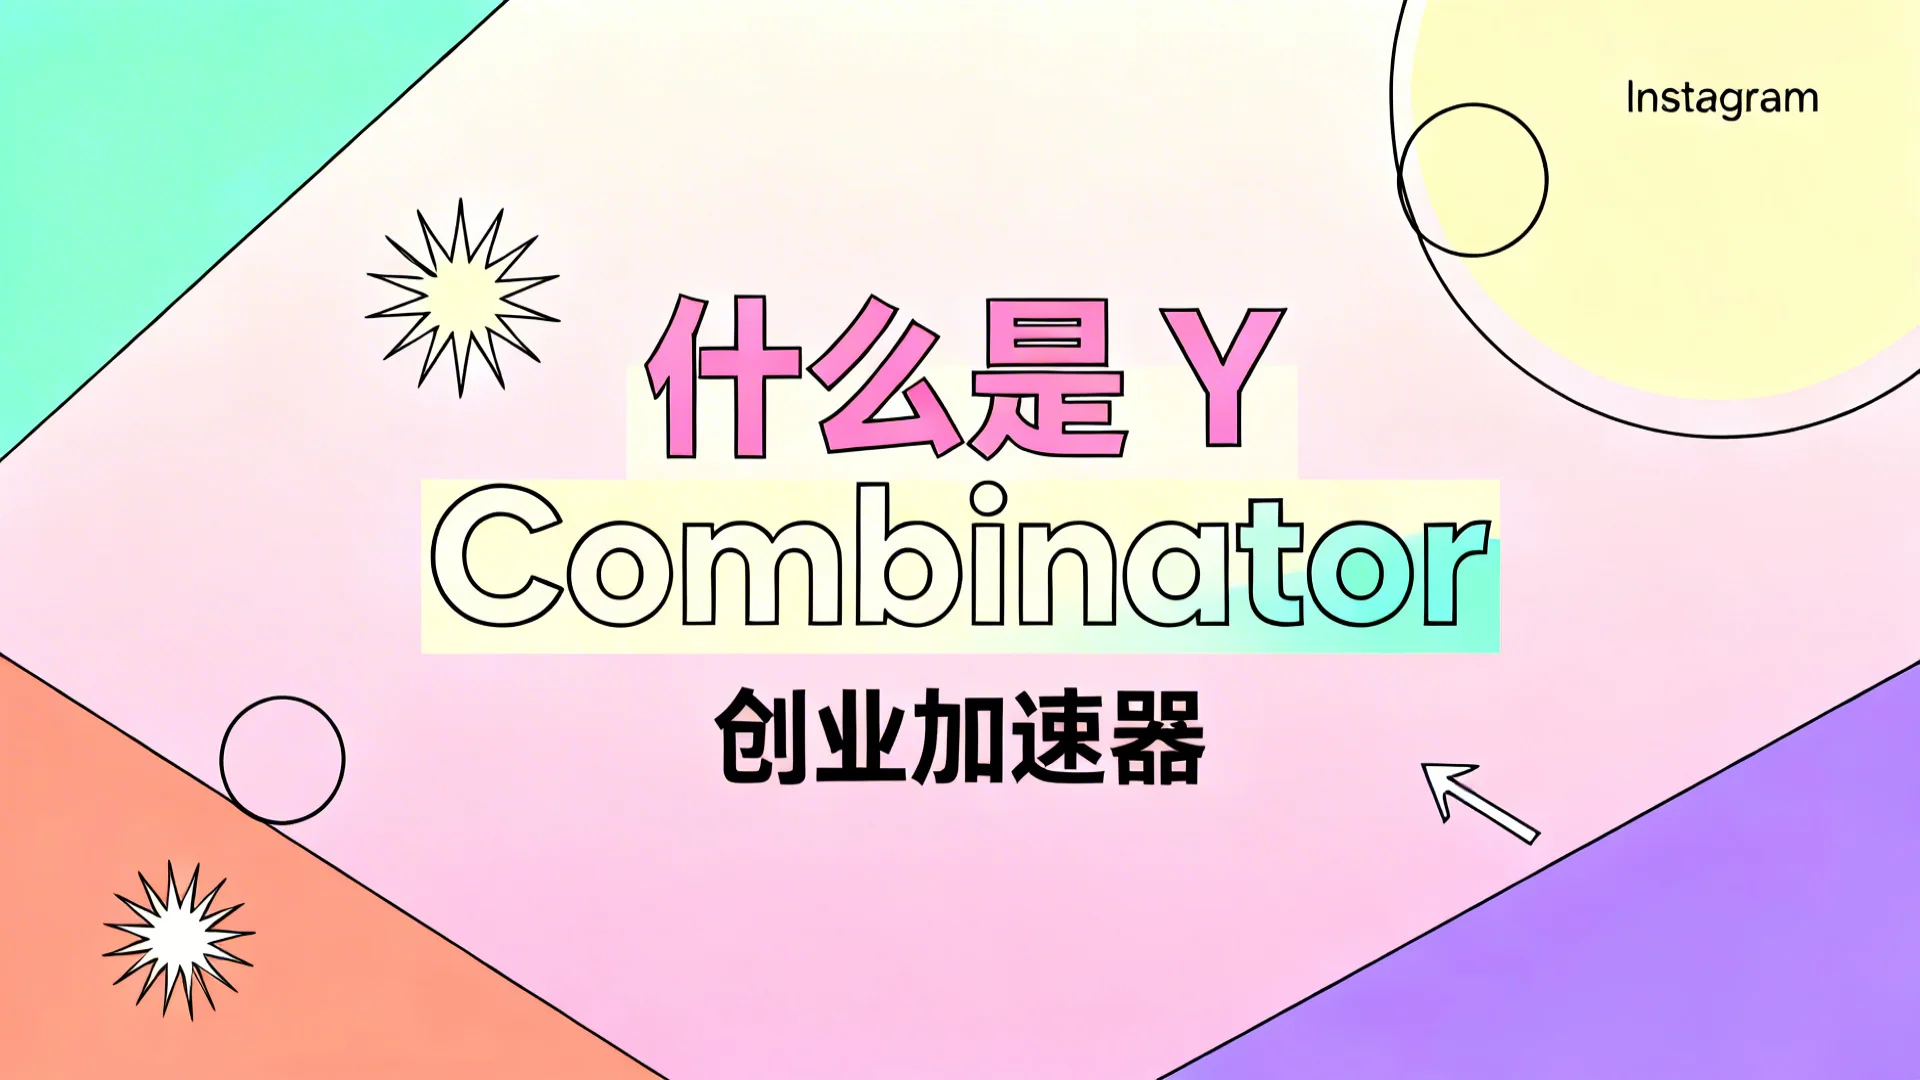
Modern Minimal Pop (现代极简波普)
Modern minimal pop art PPT slide, Instagram aesthetic, Pastel background, title text, subtitle below, key stats displayed, Pastel colors: mint #A8E6C8, cream #FFF4BD, coral #FF8B7A, purple #8B7AFF, Star burst graphics, thin line circles, Tilted color blocks, small arrows, Clean sans-serif typography, Swiss design influence, 16:9
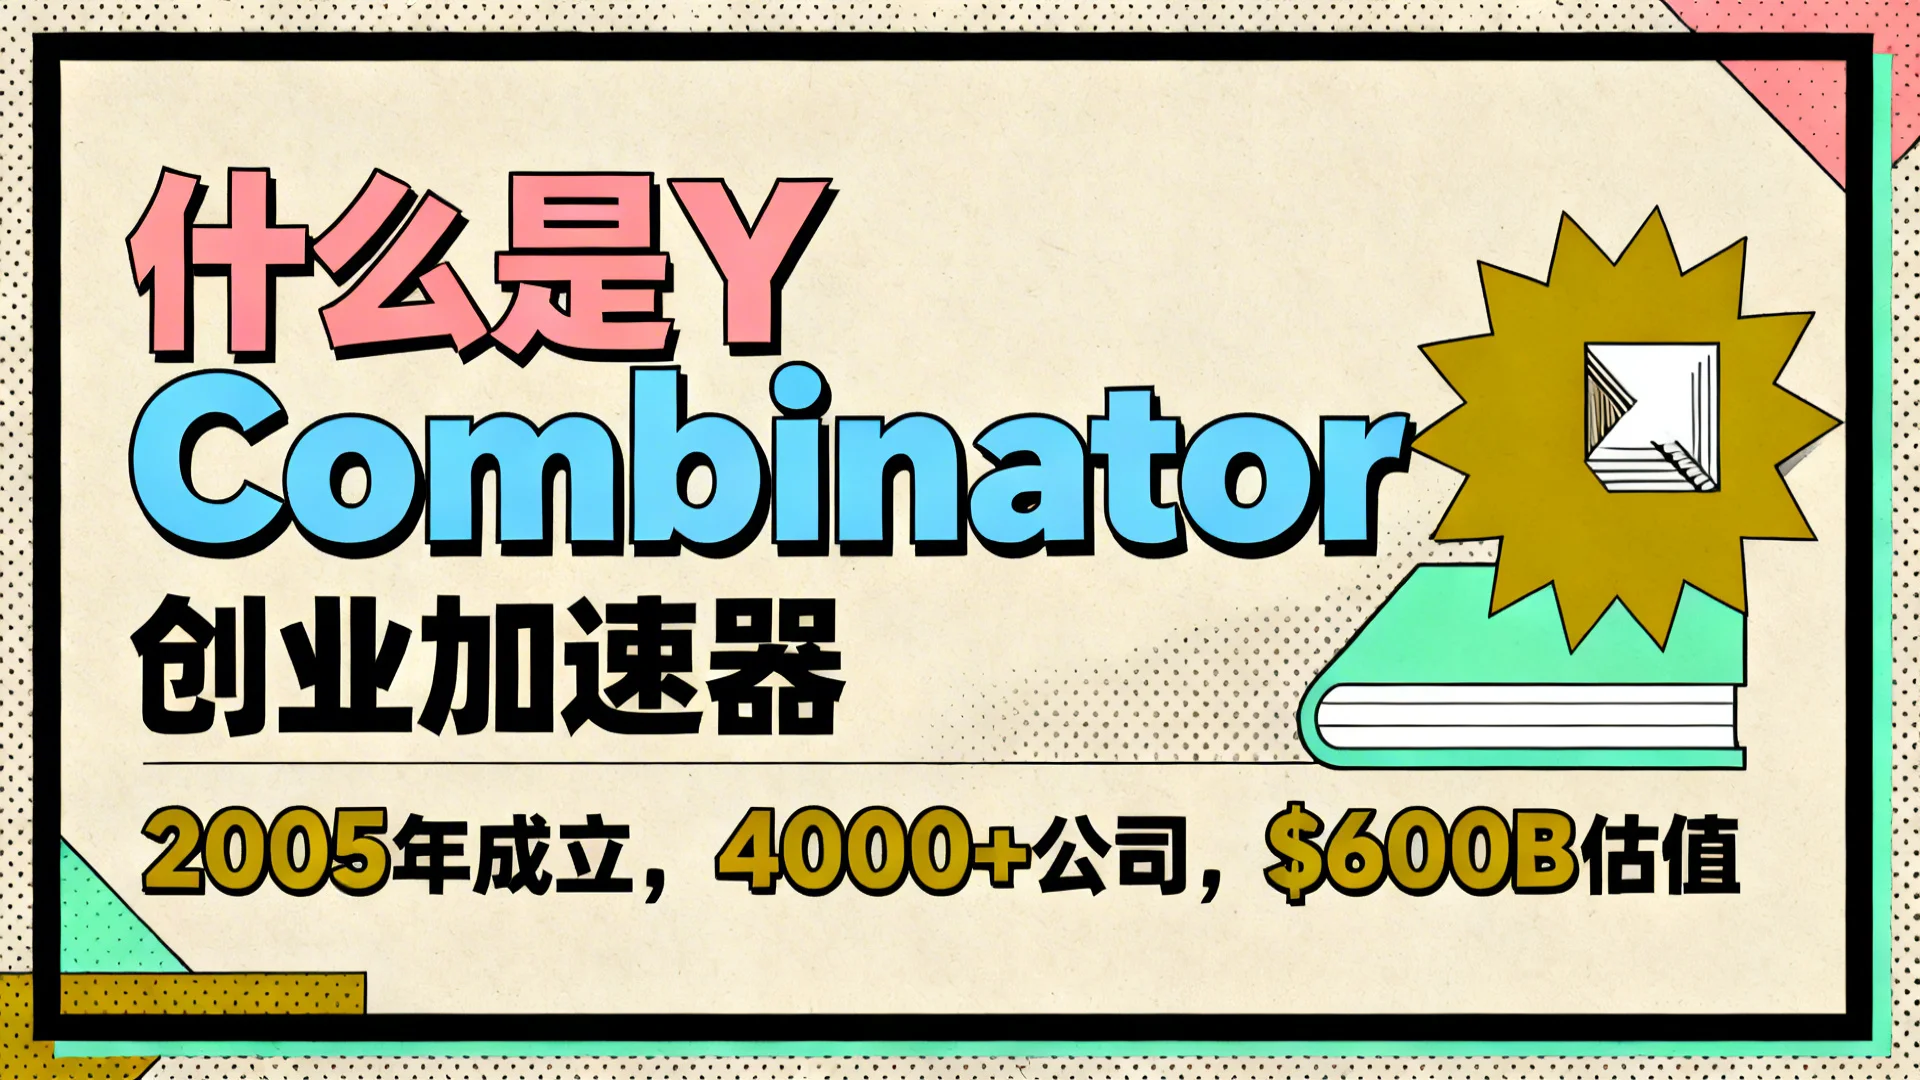
Retro Pop Art (复古波普)
Retro pop art style PPT slide, 1970s magazine aesthetic, flat design with thick black outlines, cream beige background, bold title text, subtitle below, key statistics displayed as cards, Salmon pink #FF6B6B, sky blue #4ECDC4, mustard yellow #FFD93D, mint green #6BCB77 accents, Geometric decorations: quarter circles, concentric rings, star bursts, Bold sans-serif typography, Professional presentation design, 16:9
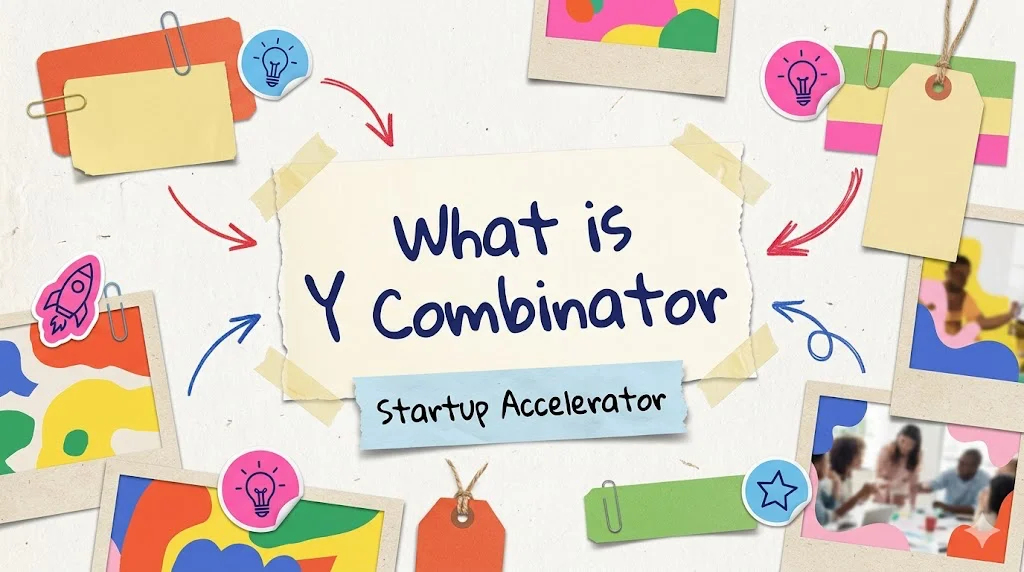
Scrapbook DIY Vibe (剪贴板手作风格)
Scrapbook DIY vibe PPT slide, poster-like handmade collage composition, off-white paper board background with subtle paper grain, hand-cut paper blocks with torn edges, transparent tape corners, sticker badges, doodled arrows, handwritten marker notes, layered polaroid-style photo cutouts, bold title on a pasted headline card, subtitle below on a small note strip, 3 to 5 key stats shown as clipped paper labels, saturated youth accents: tomato orange #FF7A59, butter yellow #FFD766, sky blue #6EC5FF, grass green #72D572, hot pink #FF5FA2, anti-grid layout, messy but readable hierarchy, social app launch poster energy, authentic DIY mood, bold sans-serif typography mixed with handwritten highlights, creative editorial presentation design, 16:9
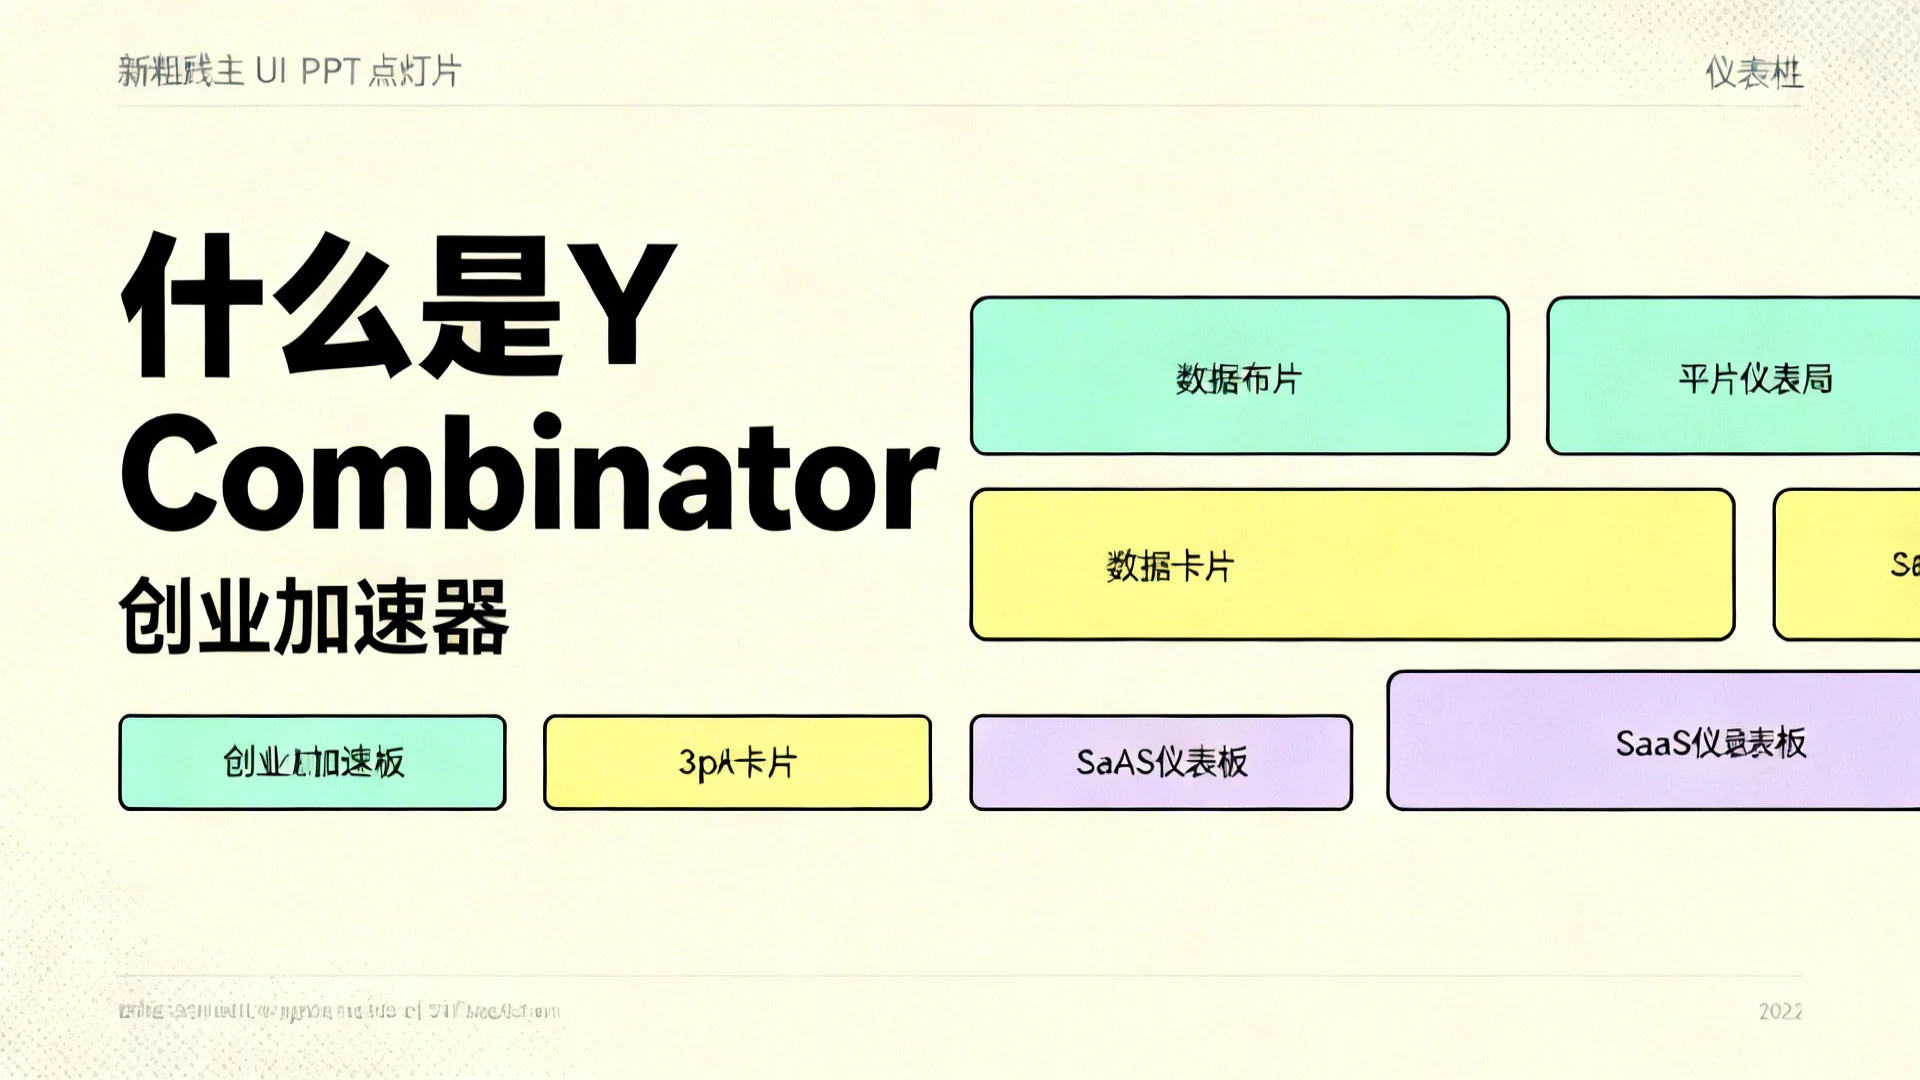
Neo-Brutalist UI (粗野主义 UI)
Neo-brutalist UI PPT slide, dashboard interface design, Cream background, title text, subtitle below, stats in cards, Pastel panels: mint #A8E4CF, yellow #FFD93D, lavender #E5B3FF, Thick 3px black outlines, Card-based layout, flat colors, Bold typography, Contemporary SaaS dashboard aesthetic, 16:9
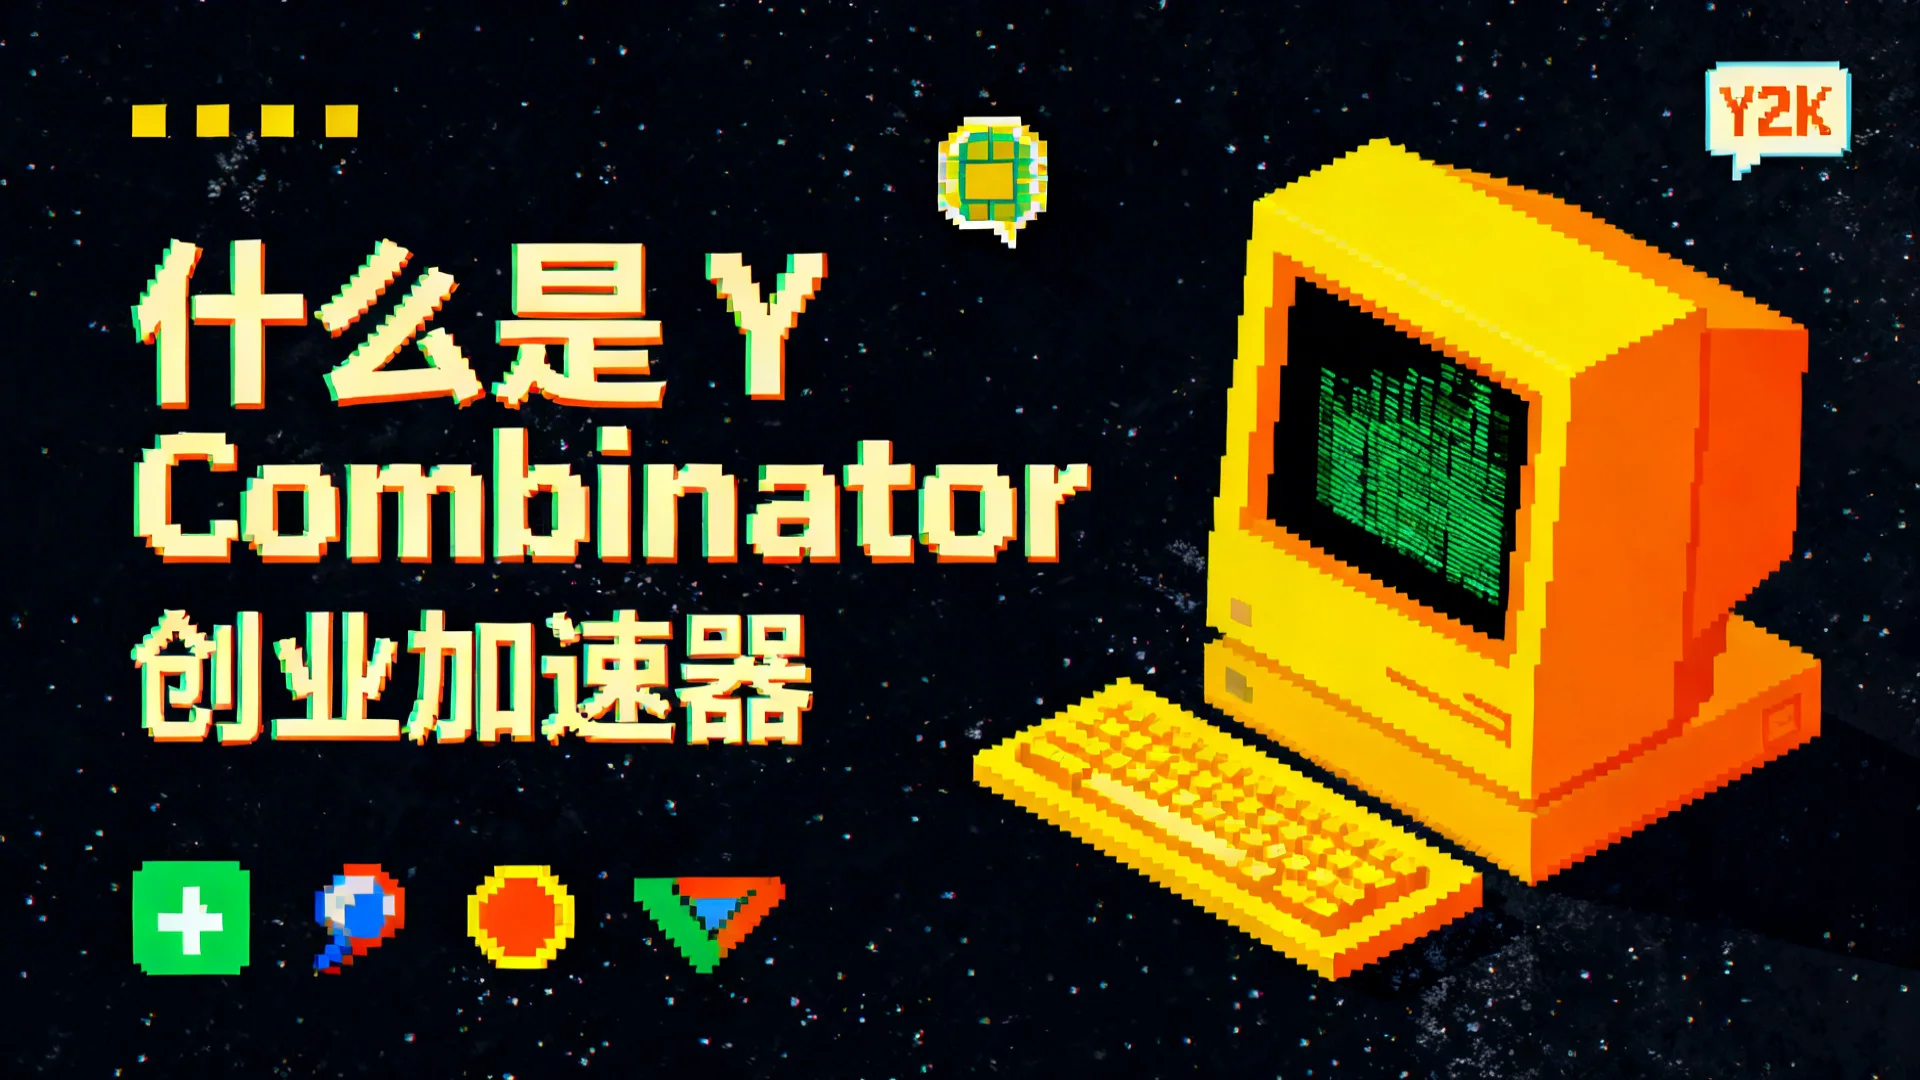
Y2K Pixel Retro (Y2K 像素复古)
Y2K pixel retro PPT slide, 1990s aesthetic, Dark background with noise texture, title text in pixel font, subtitle below, Bright colors: yellow #FFD700, orange #FF8C00, green #4A7C4E, Pixel art computer icons, CRT monitor graphics, Isometric tech illustrations, VT323 pixel font style, Vintage 1990s design, 16:9
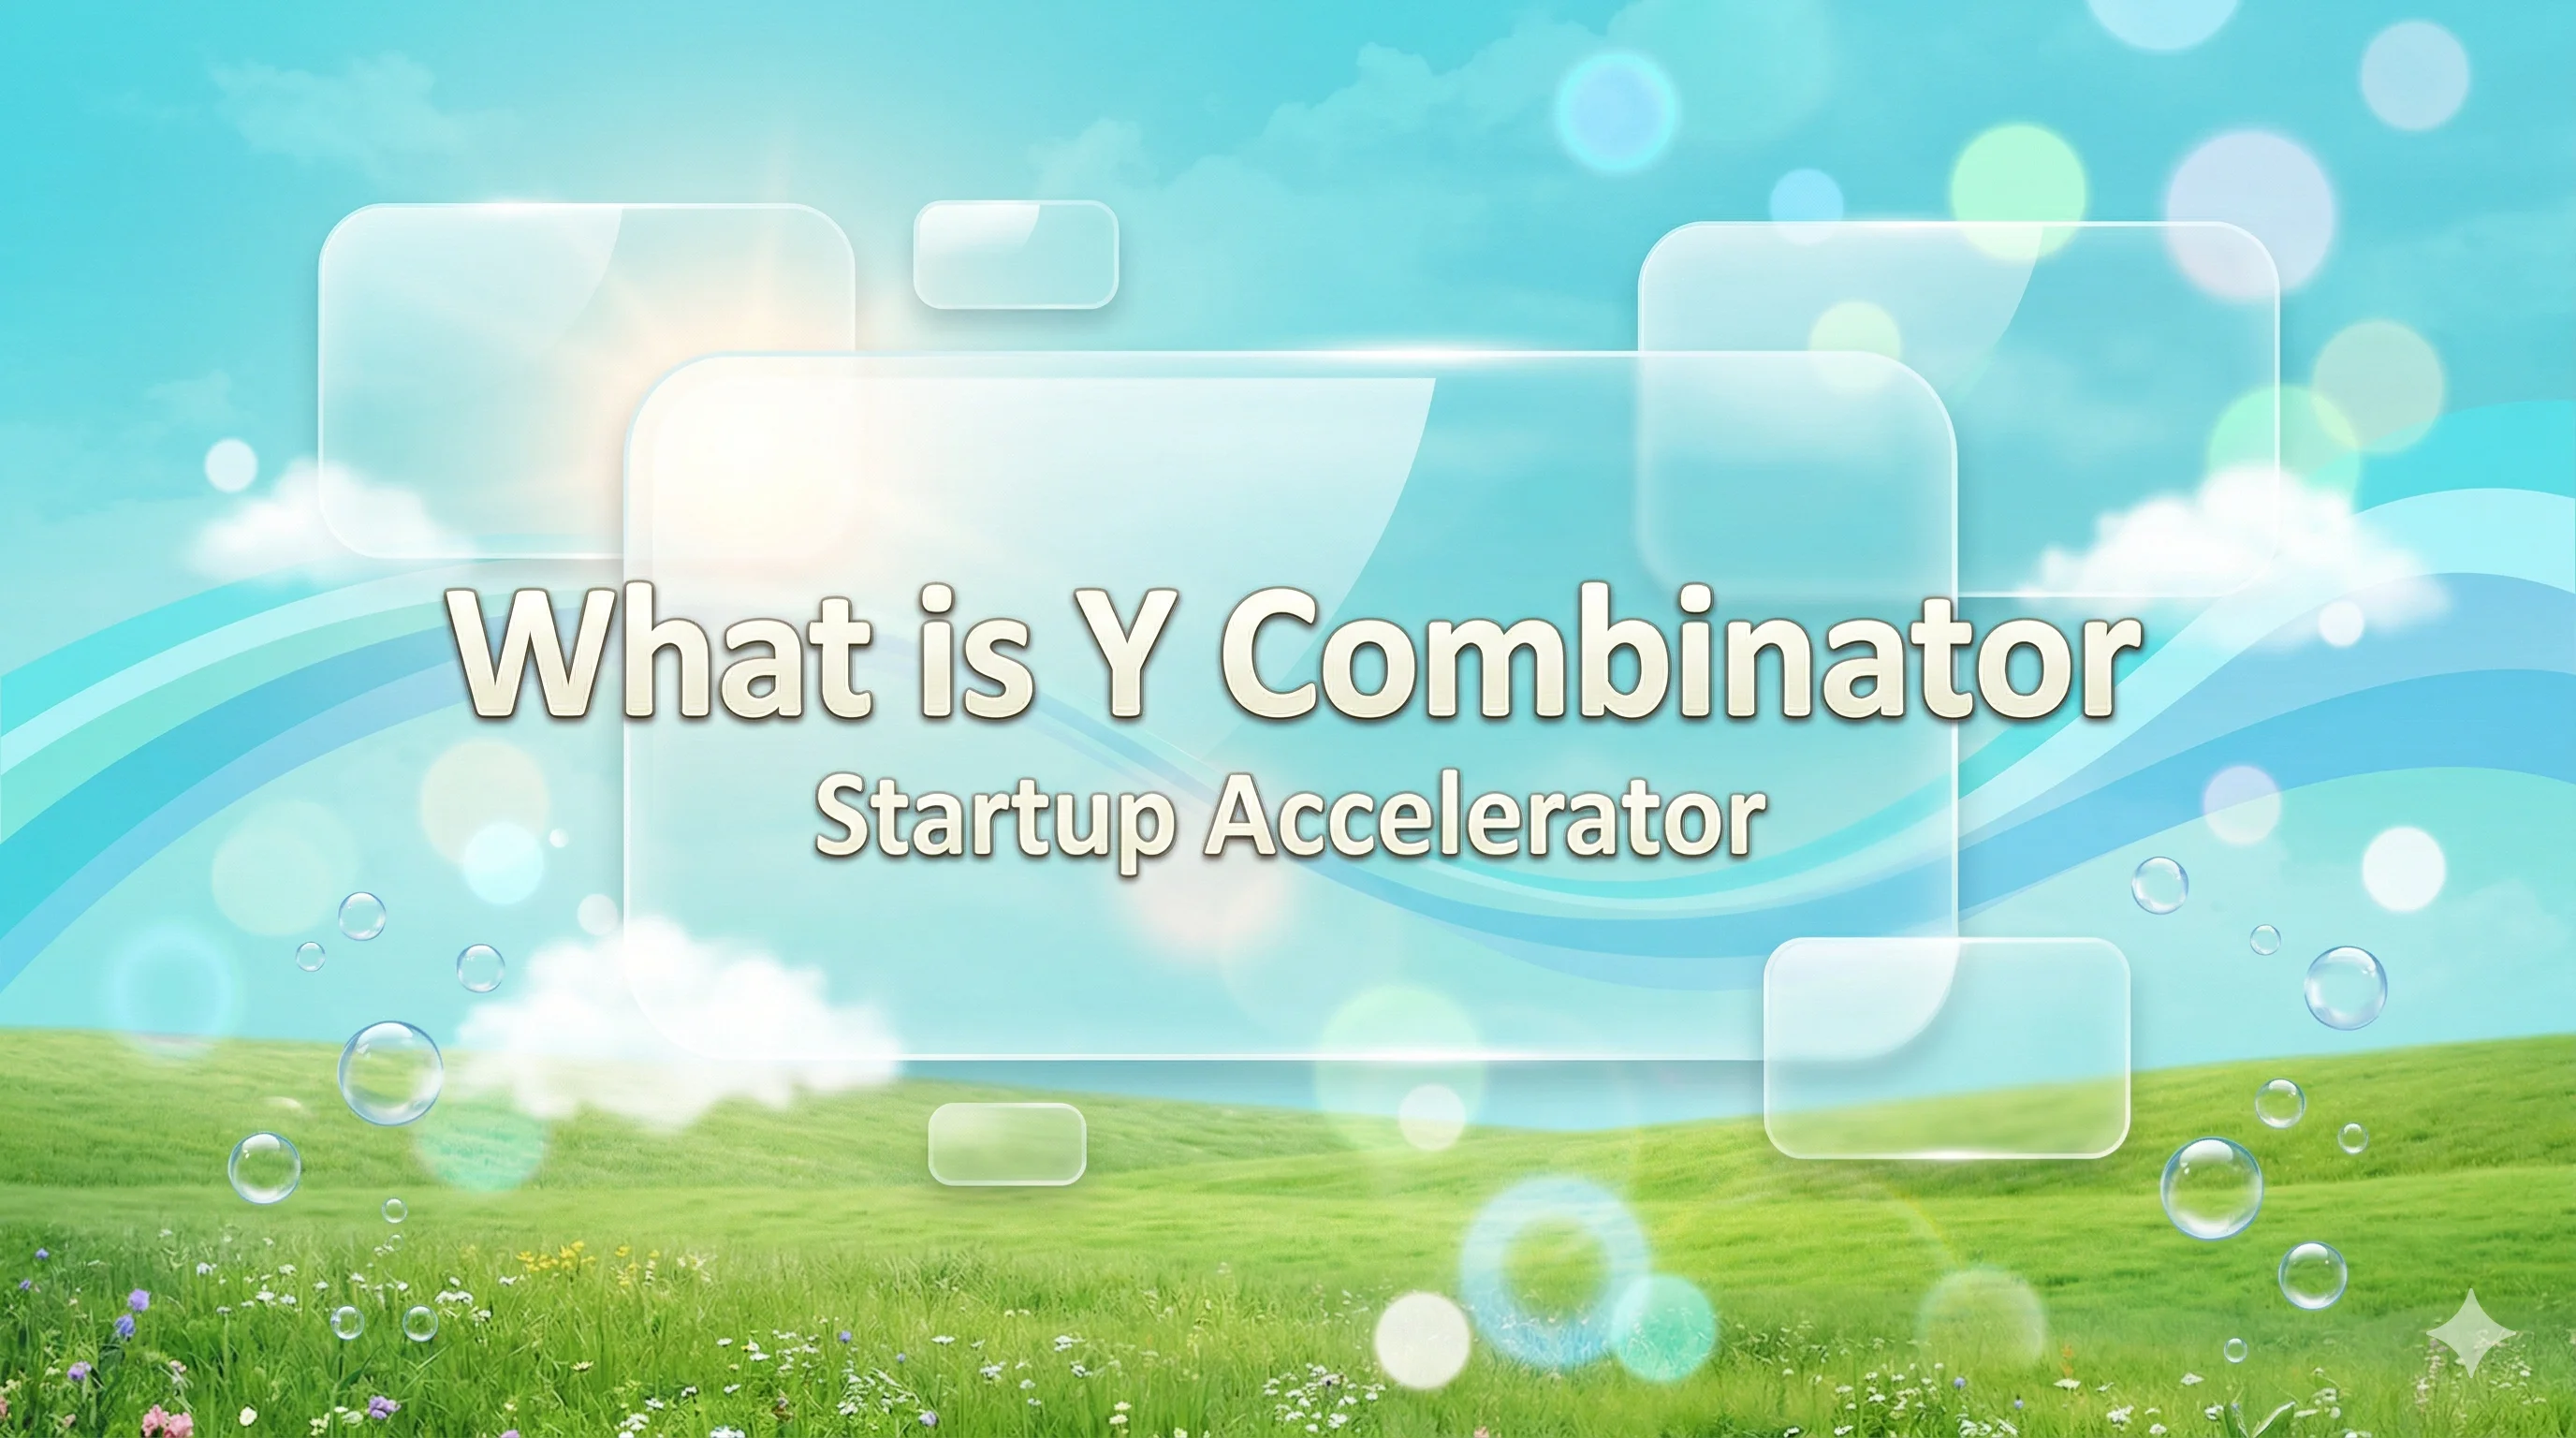
Frutiger Aero (乐观科技风)
Frutiger Aero style PPT slide, optimistic 2000s tech-utopia aesthetic, glossy translucent glass panels floating over an aqua sky and fresh green field background, bold title text, subtitle below, 3 to 5 key statistics displayed in rounded glossy cards, bright clean colors: aqua blue #7FD8FF, sky cyan #BFEFFF, grass green #7ED957, leaf green #B7F07A, pure white #FFFFFF, soft lens flare, bokeh light circles, water bubbles, gentle wave swooshes, cloudlike highlights, humanist sans-serif typography, polished corporate technology presentation, clean depth, cheerful and futuristic but friendly, Windows Vista Aero and early eco-tech ad mood, 16:9
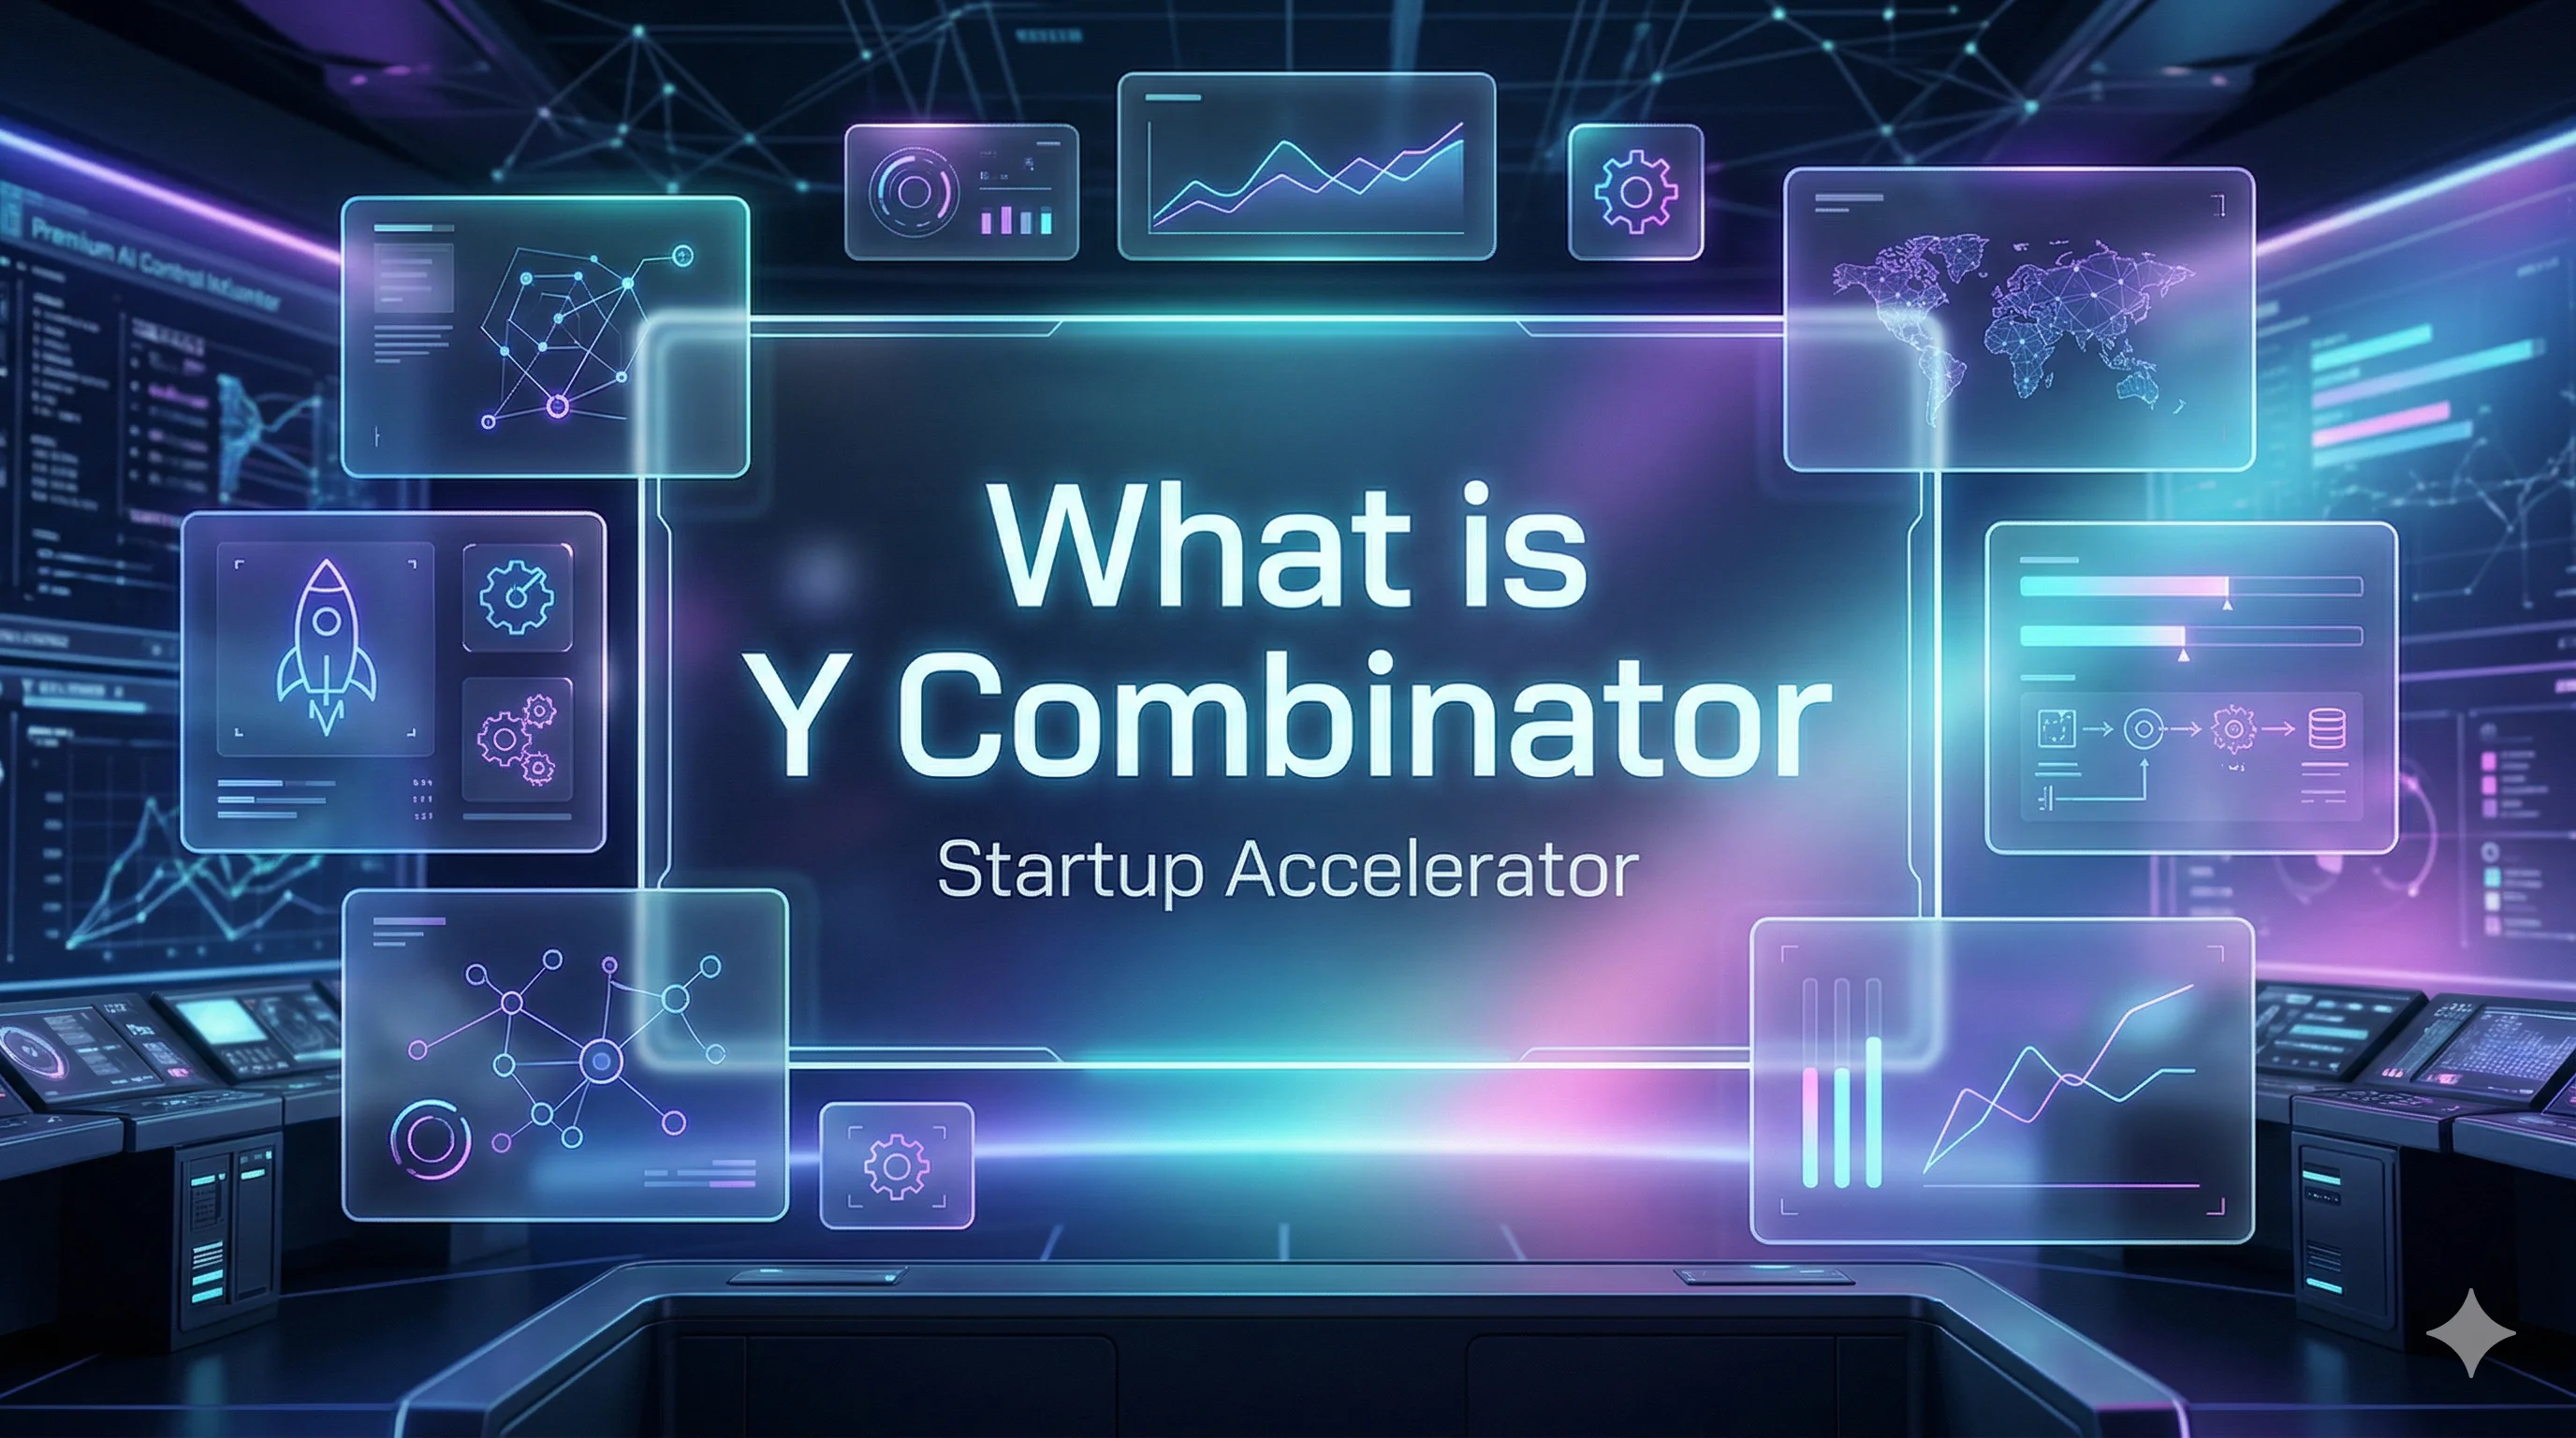
Dark Glassmorphism (暗黑玻璃拟态)
Dark glassmorphism PPT slide, premium AI control-plane aesthetic, deep obsidian background with blurred aurora glow under smoked frosted glass panels, bold title text, subtitle below, 3 to 5 KPI cards in translucent dashboard modules, thin luminous white borders, subtle cyan and violet highlights, soft reflections, layered depth, high-contrast modern sans-serif typography, elegant enterprise SaaS and copilot interface design, cinematic yet clean, 16:9
What is an AI PPT prompt?
An AI PPT prompt is a ready-made text instruction that tells an AI presentation tool exactly what slides to build — the topic, structure, tone and visual style. Instead of starting from a blank deck, you paste a prompt and get a professional, editable presentation in seconds.
How do I use these prompts to make a presentation?
Pick a prompt that matches your use case, copy it, then open SurgePix and choose the Presentation tool. Paste the prompt, adjust the topic to your needs, and generate. You can keep refining the wording to control layout, length and design.
Are these PPT prompts free to use?
Yes. Every prompt in the library is free to copy and reuse. They are curated from high-quality creator communities and updated regularly, so you can always find fresh, presentation-ready ideas at no cost.
Which AI tools work with these prompts?
The prompts are written to work with SurgePix and most modern AI presentation and slide generators. Because they are plain text, you can also adapt them for tools like ChatGPT, Gemini or Gamma to draft outlines and speaker notes.
Can I filter by use case and visual style?
Absolutely. Use the Use Cases and Styles filters to narrow the library to exactly what you need — pitch decks, reports, education, marketing and more — each paired with a real slide preview so you know what you are getting before you generate.
How often is the prompt library updated?
We add new prompts on a rolling basis, sourcing the best ideas from Reddit, X, GitHub and the SurgePix community. Bookmark the page or join our Discord to catch every update as the collection grows.